
Users Guide
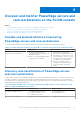
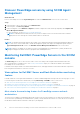
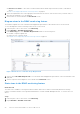
Table Of Contents
- Dell EMC Windows Server Agent-based and iDRAC7 or iDRAC8 SNMP Management Pack Version 7.3 for Microsoft System Center Operations Manager User's Guide
- Contents
- About Dell EMC Windows Server Agent-based and iDRAC7 or iDRAC8 SNMP Management Pack for SCOM
- Support Matrix for Dell EMC Windows Server Agent-based and iDRAC7 or iDRAC8 SNMP Management Pack
- Installing Dell EMC Windows Server Agent-based and iDRAC7 or iDRAC8 SNMP Management Pack
- Install Dell EMC Windows Server Agent-based and iDRAC7 or iDRAC8 SNMP Management Pack for SCOM
- Install Dell EMC Windows Server Agent-based and iDRAC7 or iDRAC8 SNMP Management Pack on multiple SCOM Management Servers
- Management features imported into SCOM console after installing Dell EMC Windows Server Agent-based and iDRAC7 or iDRAC8 SNMP Management Pack
- Repair installation issues of Dell EMC Windows Server Agent-based and iDRAC7 or iDRAC8 SNMP Management Pack
- Discover and monitor PowerEdge servers and rack workstations on the SCOM console
- Scalable and detailed editions of monitoring PowerEdge servers and rack workstations
- Discovery and classification of PowerEdge servers and rack workstations
- Discover PowerEdge servers by using SCOM Agent Management
- Monitoring Dell EMC PowerEdge Servers in the SCOM console
- View options for Dell EMC Server and Rack Workstation monitoring feature
- Alert view in the monitoring feature for PowerEdge servers and rack workstations
- Diagram views in the monitoring feature for PowerEdge servers and rack workstations
- Performance and power monitoring views in the monitoring feature for PowerEdge servers and rack workstations
- State views in the monitoring feature for PowerEdge servers and rack workstations
- View options for Dell EMC Server and Rack Workstation monitoring feature
- Discover and monitor DRACs on the SCOM console
- Supported tasks on the SCOM console
- Run Dell EMC Windows Server Agent-based and iDRAC7 or iDRAC8 SNMP Management Pack monitoring feature-based tasks on SCOM
- Tasks run on Dell EMC devices by using the Dell EMC Windows Server Agent-based and iDRAC7 or iDRAC8 SNMP Management Pack monitoring features
- Check connection to the nodes
- View warranty information of PowerEdge servers
- Launch OMSA on monolithic servers using the SCOM console
- Launch iDRAC using the SCOM console
- Launch Remote Desktop on monolithic servers using the SCOM console
- Clear Embedded Server Management (ESM) logs
- Power management-related tasks
- Generating reports
- Upgrading Dell EMC Windows Server Agent-based and iDRAC7 or iDRAC8 SNMP Management Pack
- Uninstalling Dell EMC Windows Server Agent-based and iDRAC7 or iDRAC8 SNMP Management Pack
- Reference topics
- Monitoring features supported by Dell EMC Windows Server Agent-based and iDRAC7 or iDRAC8 SNMP Management Pack
- Dell EMC Server and Rack Workstation Monitoring feature using OMSA
- DRAC Monitoring feature
- Configuring the monitoring features by using the Feature Management Dashboard
- Import monitoring features using the Dell EMC Feature Management Dashboard
- Upgrade monitoring features using the Dell EMC Feature Management Dashboard
- Customizing monitoring features using the Feature Management Dashboard for scalable and detailed editions
- Remove monitoring features using the Dell EMC Feature Management Dashboard
- Import management packs to the SCOM console
- Severity levels of discovered devices
- Discovery features supported in the monitoring of PowerEdge servers and rack workstations using OMSA
- Discovery features supported for monitoring DRACs
- Hardware components monitored by different monitoring features
- View options provided by the monitoring features of Dell EMC Windows Server Agent-based and iDRAC7 or iDRAC8 SNMP Management Pack
- Dell EMC Windows Server Agent-based and iDRAC7 or iDRAC8 SNMP Management Pack Unit Monitors
- Event rules used by different monitoring features
- Monitoring features supported by Dell EMC Windows Server Agent-based and iDRAC7 or iDRAC8 SNMP Management Pack
- Troubleshooting
- Data is not displayed on the Feature Management Dashboard
- A task run on the Feature Management Dashboard fails
- Feature Management alerts
- The Management Server (MS) is not functioning, and therefore, tasks associated with it cannot be completed (Health Service of the Feature Management Host Server is nonfunctional)
- Additional resources
- Accessing support content from the Dell EMC support site
- Contacting Dell Technologies
- Glossary
- Additional topics
- Identify device and device power status by using identification LEDs
- Migrate from Dell Server Management Pack Suite Version 6.0 for Microsoft SCOM
- Configure SCOM to monitor traps and trap-based unit monitors
- Create Run-As-Account for SNMP monitoring
- Associate multiple Run-As accounts
- Install Web Services Management (WS-Man) and SMASH device template
- Associate Run-As Account task—Dell EMC Server and Rack Workstation Monitoring feature

● Power Consumption (BTU/hr)
● Power Consumption (Watts)
NOTE: Power monitoring is applicable only for Dell EMC PowerEdge Servers with power monitoring capability for a
particular attribute. It is enabled only when the detailed edition of Dell EMC Server and Rack Workstation Monitoring
feature is present.
NOTE: Disk Performance View - iSM (%) is disabled by default and appears only when the detailed edition of the Dell
EMC Server and Rack Workstation Monitoring feature is installed and imported.
3. Select the counters from the individual performance views and select the time range for which the values are required.
The data that is collected is represented in a graphical format for each system.
Next steps
A unit monitor monitors the performance counter over two successive cycles to check if it exceeds a threshold value. When
the threshold value is exceeded, the Dell EMC PowerEdge Server changes state and generates an alert. This unit monitor is
disabled by default. You can override (enable) the threshold values in the Authoring pane of the SCOM console. Unit monitors
are available under Dell Windows Server objects for the Dell EMC Server and Rack Workstation Monitoring feature. To enable
the threshold values of unit monitors, see Enable performance and power monitoring unit monitors on page 16.
To enable the PowerEdge server performance collection rules and for more information about the performance information
collection, see Enable PowerEdge server performance collection rules set on the SCOM console on page 16.
Enable performance and power monitoring unit monitors
Steps
1. In the left pane of the SCOM console, select Authoring.
2. Expand Management Pack Objects > Monitors.
3. In the Look for field, search for Performance.
4. Right-click the unit monitor that you want to enable.
5. Select Overrides > Override the Monitor, and then select an option based on your requirement.
For example, to override the unit monitors for all objects of class: Dell Windows Server, select For all objects of class: Dell
Windows Server.
The Override Properties screen is displayed.
6. Select Enabled and set the Override Value to True.
7. In the Management Pack section, select a management pack from the drop-down list.
To create a management pack, click New and complete the tasks prompted. For more information about creating
management packs, see the Microsoft SCOM documentation.
8. Click Apply.
Enable PowerEdge server performance collection rules set on the SCOM console
About this task
By default, the server performance collection rules are disabled. To enable, perform the following actions:
Steps
1. In the left pane of the SCOM console, select Authoring.
2. Select Rules and in the Look for field, search for Enriched.
3. Right-click the rule that you want to enable, and then select Overrides > Override the Monitor > For all objects of
class.
For example, to collect data about network interface of all Dell EMC systems, right-click the following rules:
● Total Transmitted Packets
● Received Bytes
● Total Received Packets
● Transmitted Bytes
16
Discover and monitor PowerEdge servers and rack workstations on the SCOM console