
Users Guide
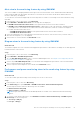
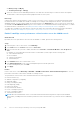
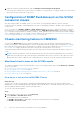
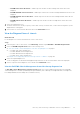
Table Of Contents
- Dell EMC OpenManage Integration Version 7.3 with Microsoft System Center (OMIMSSC) for System Center Operations Manager (SCOM) User's Guide
- Contents
- About Dell EMC OpenManage Integration with Microsoft System Center (OMIMSSC) for System Center Operations Manager (SCOM)
- Purchase and manage OMIMSSC license
- Port information and communication matrix for OMIMSSC appliance
- Support Matrix
- Deploy and configure the OMIMSSC appliance for SCOM
- Enrolling (registering) SCOM Management Group with OMIMSSC appliance for SCOM
- Create Windows Credential Profile
- Enroll SCOM Management Group and Dell EMC Alert Relay Servers with OMIMSSC for SCOM
- Modify enrollment settings
- Configuring and onboarding Dell EMC Alert Relay Servers
- Alert Relay Servers system requirements
- Prerequisites for setting up Alert Relay Servers for scaling up the number of monitored devices
- Discover Alert Relay Servers on the SCOM console
- Download and install Dell EMC Alert Relay Server Installer from the OMIMSSC Admin Portal
- Configuration changes performed by Dell EMC Alert Relay Server Installer
- Monitoring views of Dell EMC Alert Relay Servers
- Synchronize Alert Relay Servers with OMIMSSC appliance for SCOM
- Repair Dell EMC Alert Relay Server Installer installation errors
- Uninstall Dell EMC Alert Relay Server Installer
- Other tasks you can perform on the OMIMSSC Admin Portal
- Manage OMIMSSC from the SCOM console
- Discovery and monitoring of PowerEdge servers by using the licensed monitoring features of OMIMSSC
- Introduction to the licensed monitoring features of OMIMSSC for PowerEdge servers and rack workstations
- Discovery and classification of PowerEdge servers and workstations by using WS-Man or iDRAC access using Host operating system
- Prerequisites to discover PowerEdge Servers using Dell EMC Server and Rack Monitoring (Licensed)
- Discover PowerEdge servers by using iDRAC WS-Man through OMIMSSC
- Discover PowerEdge servers by using the SCOM console
- Object discoveries using WS-Man
- Configuration of alert settings on iDRAC and SCOM console
- Monitoring PowerEdge servers and rack workstations on the SCOM console
- Discover and manage PowerEdge servers by using iSM-WMI
- _
- Scalable and Detailed editions for PowerEdge servers and rack workstations using iSM-WMI
- Discovery and classification of PowerEdge servers and rack workstations using iSM-WMI
- Prerequisites for discovering PowerEdge servers by using iSM-WMI
- Discover PowerEdge servers by using iSM-WMI
- Monitoring features for PowerEdge servers and rack workstations using iSM-WMI
- View options for Dell EMC Server and Rack Workstation Monitoring feature by using iSM-WMI
- Discovery and monitoring of Dell EMC chassis using OMIMSSC
- Discovery and monitoring of Dell EMC Network Switches using OMIMSSC
- Discovery and classification of network switches
- Override properties to customize the network switch discovery process
- Discover Dell EMC Network Switches by using OMIMSSC
- Discover Dell EMC Network Switches by using SCOM
- Configuration of SNMP RunAsAccount on the SCOM console for network switches
- Network Switches monitoring feature in OMIMSSC
- Manage Dell EMC devices using the OMIMSSC appliance
- Run tasks on the SCOM console for OMIMSSC monitoring features
- Run OMIMSSC monitoring feature-based tasks on SCOM
- Tasks run on Dell EMC devices by using the OMIMSSC monitoring features
- Check connection to the nodes
- View warranty information of PowerEdge servers
- Launch OMSA on monolithic servers using the SCOM console
- Launch iDRAC using the SCOM console
- Launch Remote Desktop on monolithic servers using the SCOM console
- Perform a remote iDRAC hard reset operation
- Clear Embedded Server Management (ESM) logs
- Power management-related tasks
- Launch the Dell CMC console
- Backup and restore OMIMSSC appliance settings and data
- Upgrading the OMIMSSC appliance for SCOM
- De-enroll (Deregister) SCOM Management Group enrolled with OMIMSSC
- Remove an OMIMSSC VM
- Troubleshooting
- Deployment of OMIMSSC appliance and OMIMSSC Admin Portal-related issues
- After deploying the OMIMSSC appliance, an IP address is not assigned to the OMIMSSC appliance
- Unable to start the OpenManage Integration Dashboard in the SCOM console
- Unable to log in to the OMIMSSC Admin portal by using the Mozilla Firefox browser
- Unable to connect to the OMIMSSC appliance
- Connection is unavailable between OMIMSSC and the SCOM console
- Enrollment of SCOM Management Group with OMIMSSC appliance-related issues
- After deploying the OMIMSSC appliance, enrollment of Management Servers with OMIMSSC is unsuccessful or Dell EMC management packs are not successfully installed.
- Issues observed when usernames of local account and domain account match but the passwords differ
- Importing of Dell EMC OpenManage Integration Dashboard View Management pack fails in Microsoft System Center-Operations Manager 2012 R2
- De-enrollment of SCOM Management Group with OMIMSSC appliance-related issues
- Discovery and monitoring Dell EMC devices-related issues
- Unable to discover and monitor devices after restarting OMIMSSC
- A job run on OMIMSSC to discover a device stays in the Progress state for more than five hours
- Unable to set the SNMP trap destination on the target device(s)
- Unable to receive alerts from the discovered chassis or network switches
- Resolve issues in synchronizing data of Dell EMC devices with OMIMSSC
- Other issues
- Resolve issues in the Dell EMC Feature Management Dashboard
- Event ID 33333: Data Access Layer rejected retry on SqlError
- Unable to download Certificate Signing Request using Internet Explorer
- OMIMSSC Admin Portal displays exceptions after upgrading the appliance
- Associated devices with the Dell EMC Alert Relay Server are not deleted from the Dell EMC OpenManage Integration Dashboard if there is a network issue
- Deployment of OMIMSSC appliance and OMIMSSC Admin Portal-related issues
- Reference topics
- Monitoring features supported by OMIMSSC
- Configuring the monitoring features of OMIMSSC by using the Feature Management Dashboard
- Import monitoring features using the Dell EMC Feature Management Dashboard
- Upgrade monitoring features using the Dell EMC Feature Management Dashboard
- Customizing monitoring features using the Feature Management Dashboard for scalable and detailed editions
- Remove monitoring features using the Dell EMC Feature Management Dashboard
- Severity levels of discovered devices
- Run tasks on the SCOM console
- Override properties to customize the device discovery process
- Key features of licensed monitoring of PowerEdge servers in OMIMSSC
- System configuration lockdown mode in iDRAC9 PowerEdge servers
- iDRAC Group Manager in iDRAC9 PowerEdge servers
- Event auto resolution
- Capacity planning of PowerEdge servers discovered through iDRAC and iSM
- Detect and restore the status of a failed CMC or OpenManage Enterprise-Modular
- Port connection information of PowerEdge servers discovered through iDRAC and iSM
- Hardware components of servers and rack workstations monitored by OMIMSSC
- Hardware components of chassis monitored by OMIMSSC
- Hardware components of network switches monitored by OMIMSSC
- View options provided by the OMIMSSC monitoring features
- OMIMSSC Unit Monitors
- Unit monitors in the licensed monitoring feature of OMIMSSC and Dell EMC Windows Server Agent-based and iDRAC7 or iDRAC8 SNMP Management Pack Version 7.3 for System Center Operations Manager for PowerEdge servers and workstations
- Unit monitors for Dell EMC Chassis Monitoring feature
- Unit monitors for Dell EMC Network Switches Monitoring feature
- Event rules used by different monitoring features of OMIMSSC
- Additional resources
- Accessing support content from the Dell EMC support site
- Contacting Dell Technologies
- Glossary
- Additional topics

● Memory Usage - iSM (%)
● Overall System Usage - iSM (%)
4. Select the counters from the individual performance views and select the time range for which the values are required.
The data that is collected is represented in a graphical format for each system.
Next steps
A unit monitor monitors the performance counter over two successive cycles to check if it exceeds a threshold value. When
the threshold value is exceeded, the Dell EMC PowerEdge Server changes state and generates an alert. This unit monitor is
disabled by default. You can override (enable) the threshold values in the Authoring pane of the SCOM console. Unit monitors
are available under Dell Windows Server objects for the Dell EMC Server and Rack Workstation Monitoring feature. To enable
the threshold values of unit monitors, see Enable performance and power monitoring unit monitors on page 47.
To enable the PowerEdge server performance collection rules and for more information about the performance information
collection, see Enable PowerEdge server performance collection rules set on the SCOM console on page 52.
Enable PowerEdge server performance collection rules set on the SCOM console
About this task
By default, the server performance collection rules are disabled. To enable, perform the following actions:
Steps
1. In the left pane of the SCOM console, select Authoring.
2. Select Rules and in the Look for field, search for Enriched.
3. Right-click the rule that you want to enable, and then select Overrides > Override the Monitor > For all objects of
class.
For example, to collect data about network interface of all Dell EMC systems, right-click the following rules:
● Total Transmitted Packets
● Received Bytes
● Total Received Packets
● Transmitted Bytes
4. Select Enabled and set the Override Value to True.
5. In the Management Pack section, select a management pack from the drop-down list.
To create a management pack, click New.
6. Click Apply.
Results
In the SCOM console, select Monitoring > Dell EMC > Dell EMC Performance and Power Monitoring Views to view the
performance information collected from Dell EMC PowerEdge servers.
The performance collection rules collect information based on the following parameters:
● Disk Performance (%)
● Ambient Temperature (Centigrade)
● Amperage (Amps)
● Energy Consumption (kWh)
● Peak Amperage (Amps)
● Peak Power (Watts)
● Physical Network Interface
● Power Consumption (BTU/hr)
● Power Consumption (Watts)
● Teamed Network Interface
NOTE:
When the Detailed edition of the Server and Rack Workstation Monitoring feature is imported, the disabled
Performance (excluding Network Performance) and license-free Disk Performance (%) collection rules are enabled by
default.
52 Discover and manage PowerEdge servers by using iSM-WMI