
Users Guide
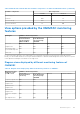
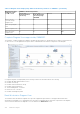
Table Of Contents
- Dell EMC OpenManage Integration Version 7.3 with Microsoft System Center (OMIMSSC) for System Center Operations Manager (SCOM) User's Guide
- Contents
- About Dell EMC OpenManage Integration with Microsoft System Center (OMIMSSC) for System Center Operations Manager (SCOM)
- Purchase and manage OMIMSSC license
- Port information and communication matrix for OMIMSSC appliance
- Support Matrix
- Deploy and configure the OMIMSSC appliance for SCOM
- Enrolling (registering) SCOM Management Group with OMIMSSC appliance for SCOM
- Create Windows Credential Profile
- Enroll SCOM Management Group and Dell EMC Alert Relay Servers with OMIMSSC for SCOM
- Modify enrollment settings
- Configuring and onboarding Dell EMC Alert Relay Servers
- Alert Relay Servers system requirements
- Prerequisites for setting up Alert Relay Servers for scaling up the number of monitored devices
- Discover Alert Relay Servers on the SCOM console
- Download and install Dell EMC Alert Relay Server Installer from the OMIMSSC Admin Portal
- Configuration changes performed by Dell EMC Alert Relay Server Installer
- Monitoring views of Dell EMC Alert Relay Servers
- Synchronize Alert Relay Servers with OMIMSSC appliance for SCOM
- Repair Dell EMC Alert Relay Server Installer installation errors
- Uninstall Dell EMC Alert Relay Server Installer
- Other tasks you can perform on the OMIMSSC Admin Portal
- Manage OMIMSSC from the SCOM console
- Discovery and monitoring of PowerEdge servers by using the licensed monitoring features of OMIMSSC
- Introduction to the licensed monitoring features of OMIMSSC for PowerEdge servers and rack workstations
- Discovery and classification of PowerEdge servers and workstations by using WS-Man or iDRAC access using Host operating system
- Prerequisites to discover PowerEdge Servers using Dell EMC Server and Rack Monitoring (Licensed)
- Discover PowerEdge servers by using iDRAC WS-Man through OMIMSSC
- Discover PowerEdge servers by using the SCOM console
- Object discoveries using WS-Man
- Configuration of alert settings on iDRAC and SCOM console
- Monitoring PowerEdge servers and rack workstations on the SCOM console
- Discover and manage PowerEdge servers by using iSM-WMI
- _
- Scalable and Detailed editions for PowerEdge servers and rack workstations using iSM-WMI
- Discovery and classification of PowerEdge servers and rack workstations using iSM-WMI
- Prerequisites for discovering PowerEdge servers by using iSM-WMI
- Discover PowerEdge servers by using iSM-WMI
- Monitoring features for PowerEdge servers and rack workstations using iSM-WMI
- View options for Dell EMC Server and Rack Workstation Monitoring feature by using iSM-WMI
- Discovery and monitoring of Dell EMC chassis using OMIMSSC
- Discovery and monitoring of Dell EMC Network Switches using OMIMSSC
- Discovery and classification of network switches
- Override properties to customize the network switch discovery process
- Discover Dell EMC Network Switches by using OMIMSSC
- Discover Dell EMC Network Switches by using SCOM
- Configuration of SNMP RunAsAccount on the SCOM console for network switches
- Network Switches monitoring feature in OMIMSSC
- Manage Dell EMC devices using the OMIMSSC appliance
- Run tasks on the SCOM console for OMIMSSC monitoring features
- Run OMIMSSC monitoring feature-based tasks on SCOM
- Tasks run on Dell EMC devices by using the OMIMSSC monitoring features
- Check connection to the nodes
- View warranty information of PowerEdge servers
- Launch OMSA on monolithic servers using the SCOM console
- Launch iDRAC using the SCOM console
- Launch Remote Desktop on monolithic servers using the SCOM console
- Perform a remote iDRAC hard reset operation
- Clear Embedded Server Management (ESM) logs
- Power management-related tasks
- Launch the Dell CMC console
- Backup and restore OMIMSSC appliance settings and data
- Upgrading the OMIMSSC appliance for SCOM
- De-enroll (Deregister) SCOM Management Group enrolled with OMIMSSC
- Remove an OMIMSSC VM
- Troubleshooting
- Deployment of OMIMSSC appliance and OMIMSSC Admin Portal-related issues
- After deploying the OMIMSSC appliance, an IP address is not assigned to the OMIMSSC appliance
- Unable to start the OpenManage Integration Dashboard in the SCOM console
- Unable to log in to the OMIMSSC Admin portal by using the Mozilla Firefox browser
- Unable to connect to the OMIMSSC appliance
- Connection is unavailable between OMIMSSC and the SCOM console
- Enrollment of SCOM Management Group with OMIMSSC appliance-related issues
- After deploying the OMIMSSC appliance, enrollment of Management Servers with OMIMSSC is unsuccessful or Dell EMC management packs are not successfully installed.
- Issues observed when usernames of local account and domain account match but the passwords differ
- Importing of Dell EMC OpenManage Integration Dashboard View Management pack fails in Microsoft System Center-Operations Manager 2012 R2
- De-enrollment of SCOM Management Group with OMIMSSC appliance-related issues
- Discovery and monitoring Dell EMC devices-related issues
- Unable to discover and monitor devices after restarting OMIMSSC
- A job run on OMIMSSC to discover a device stays in the Progress state for more than five hours
- Unable to set the SNMP trap destination on the target device(s)
- Unable to receive alerts from the discovered chassis or network switches
- Resolve issues in synchronizing data of Dell EMC devices with OMIMSSC
- Other issues
- Resolve issues in the Dell EMC Feature Management Dashboard
- Event ID 33333: Data Access Layer rejected retry on SqlError
- Unable to download Certificate Signing Request using Internet Explorer
- OMIMSSC Admin Portal displays exceptions after upgrading the appliance
- Associated devices with the Dell EMC Alert Relay Server are not deleted from the Dell EMC OpenManage Integration Dashboard if there is a network issue
- Deployment of OMIMSSC appliance and OMIMSSC Admin Portal-related issues
- Reference topics
- Monitoring features supported by OMIMSSC
- Configuring the monitoring features of OMIMSSC by using the Feature Management Dashboard
- Import monitoring features using the Dell EMC Feature Management Dashboard
- Upgrade monitoring features using the Dell EMC Feature Management Dashboard
- Customizing monitoring features using the Feature Management Dashboard for scalable and detailed editions
- Remove monitoring features using the Dell EMC Feature Management Dashboard
- Severity levels of discovered devices
- Run tasks on the SCOM console
- Override properties to customize the device discovery process
- Key features of licensed monitoring of PowerEdge servers in OMIMSSC
- System configuration lockdown mode in iDRAC9 PowerEdge servers
- iDRAC Group Manager in iDRAC9 PowerEdge servers
- Event auto resolution
- Capacity planning of PowerEdge servers discovered through iDRAC and iSM
- Detect and restore the status of a failed CMC or OpenManage Enterprise-Modular
- Port connection information of PowerEdge servers discovered through iDRAC and iSM
- Hardware components of servers and rack workstations monitored by OMIMSSC
- Hardware components of chassis monitored by OMIMSSC
- Hardware components of network switches monitored by OMIMSSC
- View options provided by the OMIMSSC monitoring features
- OMIMSSC Unit Monitors
- Unit monitors in the licensed monitoring feature of OMIMSSC and Dell EMC Windows Server Agent-based and iDRAC7 or iDRAC8 SNMP Management Pack Version 7.3 for System Center Operations Manager for PowerEdge servers and workstations
- Unit monitors for Dell EMC Chassis Monitoring feature
- Unit monitors for Dell EMC Network Switches Monitoring feature
- Event rules used by different monitoring features of OMIMSSC
- Additional resources
- Accessing support content from the Dell EMC support site
- Contacting Dell Technologies
- Glossary
- Additional topics

NOTE: Dell Technologies recommends you to update the “Dell OM : System configuration lockdown alert rule interval”
immediately after the server discovery interval is updated or modified. This ensures that the System Lockdown mode alert is
generated after the completion of server discovery with a certain interval.
You can view information about the System Configuration Lockdown mode in the Detail View pane of the Dell EMC Diagram
View. For more information about this feature, see the iDRAC9 Version 3.00.00.00 User’s Guide available on the support
site. This feature is available for servers that are discovered by using iDRAC and iSM methods of Dell EMC Server and Rack
Workstation Monitoring (Licensed) feature.
iDRAC Group Manager in iDRAC9 PowerEdge servers
The iDRAC Group Manager feature is available for iDRAC9—based PowerEdge servers to offer simplified basic management
of iDRAC, and associated servers on the same local network. Group Manager feature enables one-to-many console experience
without requiring a separate application. Using the iDRAC Group Manager, you can view information about a set of servers by
permitting more powerful management than by inspecting servers visually for faults and other manual methods.
You can view information about the iDRAC Group Manager, iDRAC Group Manager Status, and iDRAC Group Name under the
iDRAC object in the Detail View pane of the Diagram View. For more information about this feature, see the iDRAC9 Version
3.00.00.00 User's Guide available on the support site. This feature is available for servers that are discovered by using the
iDRAC and iSM methods of Dell EMC Server and Rack Workstation Monitoring (Licensed) feature.
Event auto resolution
This section describes the automatic resolution or acknowledgment of the Dell device events using the Event Auto Resolution
feature.
Dell EMC Windows Server Agent-based and iDRAC7 or iDRAC8 SNMP Management Pack for Microsoft System Center
Operations Manager receives and processes the events from the Dell devices. These events can be broadly classified as issue,
information, and resolution events. All these events remain on the console until they are manually closed. Even after the issue
gets resolved at the node, the issue event, and the corresponding resolution event remains in the console until they are manually
acknowledged. Event Auto Resolution feature automatically resolves or acknowledges such Dell device events.
The auto resolution of events can be classified as:
● Problem to problem—One problem event resolves another problem event. For example, a temperature sensor sends a
warning event when it crosses the warning threshold. If there is no action, after certain time, the same sensor sends critical
event when it crosses the critical event. In this case, there is no importance of the warning event, because it does not exist.
The warning event is acknowledged, and only critical event is displayed on the console.
● Problem to resolution—One resolution or a normal event resolves a problem event. For example, a temperature sensor sends
a warning event when it crosses the warning threshold. When the administrator takes appropriate action, the same sensor
sends the resolution event or normal event after certain time. In this case, there is no importance of the warning event,
because it does not exist. The warning event is acknowledged, and only normal event is displayed on the console.
This feature is available only for servers that are discovered through iDRAC WS-Man. By default, the Event Auto Resolution
disabled. Enable this feature by using the Enable Event Auto Resolution task. The tasks such as Enable Event Auto Resolution
and Disable Event Resolution, are available under Dell EMC > Dell EMC Feature Management Dashboard > Dell EMC
Server and Rack Workstation Monitoring (Licensed) > Dell EMC Monitoring Feature Tasks.
Capacity planning of PowerEdge servers discovered through iDRAC
and iSM
You can monitor if the server’s utilization has exceeded the configured capacity threshold value using the Dell Server Capacity
Check unit monitor. The unit monitor—Dell Server Capacity Check monitors the average system or CUPS usage for the last one
day of each server against the configured capacity threshold value. By default, this unit monitor is disabled. To enable the Dell
Server Capacity Check unit monitor, see Enable performance and power monitoring unit monitors on page 47.
The minimum threshold value is 1, and the maximum threshold value is 99. The default threshold value is 60. You can configure
the threshold values within the specified range. That is, 1–99. In case, you provide a threshold value other than the specified
ranges, that threshold is reset to its default value.
A warning event per server is generated when the average system or CUPS usage for the last one day exceeds the configured
threshold value. The warning event is auto resolved when the average system or CUPS usage for the last one day returns within
the configured threshold value.
104
Reference topics