
Users Guide

Filtering Data
You can filter the results by dragging and dropping column headers to the top of reports. You can choose
one or more attributes when revising the view to meet your specific needs.
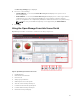
For example, in Devices by Status pie chart, click a status such as Critical. In the Device Summary page,
drag the Device Type and Service Tag to the top of the report. The view immediately changes to a nested
information based on your preference. In this example, the information is grouped first by Device Type,
and second by Service Tag. Drill-down through these filtered groups to view the remaining information
for the devices.
For more information, see Viewing Device Summary.
Search Bar
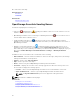
The search bar is displayed at the top-right of the dashboard below the heading banner. The search bar is
accessible from all portal pages, except when a pop-up or wizard is displayed. As you type text in the
search bar, matching or similar item are displayed in the drop-down list.
Related References
Search Items
Search Drop-Down List
Selection Actions
Search Items
You can search for the following using the search bar:
• Devices
• Device groups
• Discovery ranges
• Discovery range groups
• Exclude ranges
• Portals
• Wizards
• Remote tasks
• Preferences and settings
When a range, task, device, and so on is changed or created in the console, it is added to the searchable
items within 20 seconds.
Related References
Search Bar
Search Drop-Down List
The search bar displays a list as you type text in the search box. The items that contain the characters that
you type are populated in the search drop-down list. Each item in the drop-down list includes two icons
46