
Users Guide

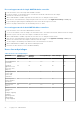
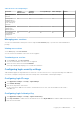


Table Of Contents
- Dell EMC OpenManage Enterprise-Modular Edition Version 1.20.10 for PowerEdge MX7000 Chassis User's Guide
- Overview
- Updating firmware for PowerEdge MX solution
- Updating MX7000 components using OME-Modular 1.20.10
- Upgrading ethernet switch using DUP
- Logging in to OME-Modular
- Logging in to OME–Modular as local, Active Directory, or LDAP user
- OME-Modular home page
- Viewing device health
- Setting up chassis
- Initial configuration
- Configuring chassis settings
- Managing chassis
- Chassis groups
- Controlling chassis power
- Backing up chassis
- Restoring chassis
- Exporting chassis profiles
- Managing chassis failover
- Troubleshooting in chassis
- Blinking LEDs
- Interfaces to access OME-Modular
- Viewing chassis hardware
- Viewing chassis alerts
- Viewing chassis hardware logs
- Configuring OME–Modular
- Viewing current configuration
- Configuring users and user settings
- Configuring login security settings
- Configuring alerts
- Managing compute sleds
- Managing storage
- Managing templates
- Managing identity pools
- Ethernet IO Modules
- MX Scalable Fabric architecture
- SmartFabric Services
- Managing networks
- Managing Fibre Channel IOMs
- Managing firmware
- Monitoring alerts and logs
- Monitoring audit logs
- Use case scenarios
- Troubleshooting
- Storage
- Firmware update is failing
- Storage assignment is failing
- SAS IOM status is downgraded
- SAS IOM health is downgraded
- Drives on compute sled are not visible
- Storage configuration cannot be applied to SAS IOMs
- Drives in OpenManage are not visible
- iDRAC and OpenManage drive information do not match
- The assignment mode of storage sled is unknown
- Unable to access OME-Modular using Chassis Direct
- Troubleshooting lead chassis failure
- Storage
- Recommended slot configurations for IOMs
- Upgrading networking switch using different DUP versions
- Upgrading networking switch using CLI

Table 12. Compute sled replacement - Behavior of OME-Modular and LCD panel
OME-Modular behavior LCD behavior
Case 1 Enables users to clear all mappings to
the compute sled.
Enables users to clear all mappings to
the compute sled.
Case 2 Enables users to clear or retain all
mappings to the compute sled.
Enables users to clear or retain all
mappings to the compute sled.
Viewing compute hardware
You can view the details of the hardware components that are installed in the compute sled, on the compute Hardware page.
The hardware components include processor, storage controller, and FRU.
The deployment and configuration jobs on the compute sled are performed only for the first time, if the profile and sled device
ID are unchanged. If the sled is removed and reinserted, the deployment and configuration job is not performed. This condition is
applicable to the Edit Profile task too.
NOTE: If the storage controller cards are absent in iDRAC, the storage enclosure details are not displayed on the Compute
> View Details > Hardware > Storage Enclosure page.
Viewing compute firmware
You can view the firmware list for the compute in the compute Firmware page. Click Devices > Compute > View Details >
Firmware.
The details include name of the device or component, impact assessment, current version, and baseline version.
You can perform the following tasks on the Firmware page:
● Select a baseline from the Baseline drop-down to view the list of components and their current and baseline firmware
versions. You can select the component for which you want to update the firmware.
● Update the existing firmware on the compute using Update Firmware.
● Downgrade the updated firmware version to the previous version using Rollback Firmware.
● Export the firmware baseline report in a .csv format using Export.
Viewing compute hardware logs
The logs of activities performed on the hardware components associated with the compute sled are displayed on the compute
Hardware Logs page. The log details that are displayed include severity, message ID, category, timestamp, and description.
To view the hardware logs, click Devices > Compute > View Details > Hardware Logs.
You can also perform the following tasks on the Hardware Logs page:
● Filter the logs using Advanced Filter—You can filter the logs based on severity, message ID, start date, end date, or
category.
● Select logs and include comments for them using Add Comment.
● Export logs displayed on the current page or export specific logs using Export.
Viewing compute alerts
You can view the list of alerts and warnings for compute sleds on the Alerts page.
To view the compute alerts, click Devices > Compute > View Details > Alerts.
You can sort the list of alerts based on the following advanced filters:
● Severity
● Acknowledge
● Start Date
60
Managing compute sleds