
Users Guide


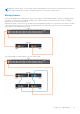


Table Of Contents
- Dell EMC OpenManage Enterprise-Modular Edition for PowerEdge MX7000 Chassis User's Guide
- Contents
- Overview
- Updating firmware for PowerEdge MX solution
- MX7000 Solution Baselines
- Upgrading ethernet switch using DUP
- OME-Modular licenses
- Logging in to OME-Modular
- Logging in to OME–Modular as local, Active Directory, or LDAP user
- Logging in to OME-Modular using OpenID Connect
- OME-Modular home page
- Viewing device health
- Setting up chassis
- Initial configuration
- Configuring chassis settings
- Managing chassis
- Chassis groups
- Controlling chassis power
- Backing up chassis
- Restoring chassis
- Exporting chassis profiles
- Managing chassis failover
- Troubleshooting in chassis
- Blinking LEDs
- Interfaces to access OME-Modular
- Viewing chassis hardware
- Viewing chassis alerts
- Viewing chassis hardware logs
- Configuring OME–Modular
- Viewing current configuration
- Configuring users and user settings
- Configuring login security settings
- Configuring alerts
- Managing compute sleds
- Managing Profiles
- Managing storage
- Managing templates
- Managing identity pools
- Ethernet IO Modules
- MX Scalable Fabric architecture
- SmartFabric Services
- Managing networks
- Managing Fibre Channel IOMs
- Managing firmware
- Monitoring alerts and logs
- Monitoring audit logs
- Use case scenarios
- Troubleshooting
- Storage
- Firmware update is failing
- Storage assignment is failing
- SAS IOM status is downgraded
- SAS IOM health is downgraded
- Drives on compute sled are not visible
- Storage configuration cannot be applied to SAS IOMs
- Drives in OpenManage are not visible
- iDRAC and OpenManage drive information do not match
- The assignment mode of storage sled is unknown
- Unable to access OME-Modular using Chassis Direct
- Troubleshooting lead chassis failure
- Storage
- Recommended slot configurations for IOMs
- Creating validated firmware solution baseline using Dell Repository Manager
- Upgrading networking switch using different OS10 DUP versions
- Upgrading networking switch using CLI

Viewing chassis overview
On the chassis Overview page, you can click View Slot Information to view the compute sled slot details. A graphical
representation of the chassis is displayed on the left side. Information about the chassis is displayed below the graphical
representation. The information includes FIPS status of the chassis, name, model, service tag, asset tag, express service code,
management IP, firmware version, power state, and faceplate power of the chassis. Click View Devices to view the list of all
devices on the All Devices page.
You can also see information under the following sections:
● Chassis Subsystems—Displays the health status of the chassis components such as battery, fan, IOMs, and power supply.
Fabric Consistency Check (FCC) information and health change is displayed under Chassis Subsystems. But the FCC
details of the compute sled are not displayed in the chassis graphical representation and the compute Overview page.
● Environment—Displays the power consumption units and temperature of the chassis. Click View Power Statistics
to view the chassis power consumption details such as current redundancy state, peak headroom, and system energy
consumption. Click Reset to reset the power statistics and start monitoring period. Click Power Usage to view the chassis
power supply information about the Chassis > Hardware > Chassis Power Supplies page. If a failover or management
module reboot is performed, the last reset power statistics timestamp is updated based on the failover or management
module reboot timestamp.
Click View Temperature Statistics to view information such as the duration, date, and time when temperature details
recording began, peak temperature, timestamp, minimum temperature, and timestamp. Click Reset to reset the temperature
statistics and start monitoring period.
NOTE: The power consumption value for compute sled device is rounded off and may display lesser than minimum
power.
NOTE: The temperature statistics timestamp remains unchanged after a failover or management module reboot.
● Recent Alerts—Displays the number and details of the tasks that are performed in the chassis. Click View All to view the
list of all alerts that are related to the compute sled on the Chassis > Alerts page.
● Recent Activity—Displays the status of the jobs that are performed in the compute sled.
● Server Subsystems—Displays a summary of information about the server sub systems. The information includes the health
status of the components such as battery, memory, processor, and voltage.
If you have the Chassis Administrator privileges, you can perform the following tasks in this tab:
● Power Control tasks:
○ Power Off (Non-graceful)—Turns off the chassis power, which is equivalent to pressing the forceful power button
when the chassis is turned on. This option is disabled if the chassis is already turned off. It does not notify the server
operating system.
○ Power Cycle System (Cold Boot)—Turns off and then restarts the chassis forcefully (cold boot). This option is
disabled if the chassis is already turned off.
In the command-line interface, the power cycle action results in a graceful restart of the chassis.
NOTE:
When the chassis is power cycled all devices in the chassis are also powered cycled. The management
module does not get power cycled. However, the alerts logged may report that the connectivity was lost due to a
power cycle operation.
○ Power Off (Graceful)—Notifies the server operating system to turn off the chassis. This option is disabled if the
chassis is already turned off.
● Configuration tasks:
○ Create Chassis Group
○ Join Chassis Group
○ Initial Configuration
● Troubleshooting tasks:
○ Extract Log
○ Diagnostic Commands
○ Reset management module
○ Terminate serial connection
● Turn-on or turn off LEDs using Blink LED.
● Back up, restore, export chassis profile, and perform failover.
46
Logging in to OME-Modular