
Users Guide
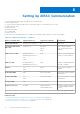
Table Of Contents
- Integrated Dell Remote Access Controller 8 (iDRAC8) Version 2.05.05.05 User's Guide
- Contents
- Overview
- Benefits of Using iDRAC With Lifecycle Controller
- Key Features
- New In This Release
- How To Use This User's Guide
- Supported Web Browsers
- Managing Licenses
- Licensable Features In iDRAC8
- Interfaces and Protocols to Access iDRAC
- iDRAC Port Information
- Other Documents You May Need
- Social Media Reference
- Contacting Dell
- Accessing support content from the Dell EMC support site
- Logging into iDRAC
- Logging into iDRAC as Local User, Active Directory User, or LDAP User
- Logging into iDRAC Using Smart Card
- Logging into iDRAC Using Single Sign-on
- Accessing iDRAC Using Remote RACADM
- Accessing iDRAC Using Local RACADM
- Accessing iDRAC Using Firmware RACADM
- Accessing iDRAC Using SMCLP
- Logging in to iDRAC Using Public Key Authentication
- Multiple iDRAC Sessions
- Changing Default Login Password
- Enabling or Disabling Default Password Warning Message
- Setting Up Managed System and Management Station
- Setting Up iDRAC IP Address
- Setting Up Management Station
- Setting Up Managed System
- Configuring Supported Web Browsers
- Updating Device Firmware
- Downloading Device Firmware
- Updating Firmware Using iDRAC Web Interface
- Updating Device Firmware Using RACADM
- Scheduling Automatic Firmware Updates
- Updating Firmware Using CMC Web Interface
- Updating Firmware Using DUP
- Updating Firmware Using Remote RACADM
- Updating Firmware Using Lifecycle Controller Remote Services
- Updating CMC Firmware From iDRAC
- Viewing and Managing Staged Updates
- Rolling Back Device Firmware
- Backing Up Server Profile
- Importing Server Profile
- Monitoring iDRAC Using Other Systems Management Tools
- Configuring iDRAC
- Viewing iDRAC Information
- Modifying Network Settings
- Configuring Services
- Using VNC Client to Manage Remote Server
- Configuring Front Panel Display
- Configuring Time Zone and NTP
- Setting First Boot Device
- Enabling or Disabling OS to iDRAC Pass-through
- Obtaining Certificates
- Configuring Multiple iDRACs Using RACADM
- Disabling Access to Modify iDRAC Configuration Settings on Host System
- Viewing iDRAC and Managed System Information
- Viewing Managed System Health and Properties
- Viewing System Inventory
- Viewing Sensor Information
- Monitoring Performance Index of CPU, Memory, and I/O Modules
- Checking the System for Fresh Air Compliance
- Viewing Historical Temperature Data
- Viewing Network Interfaces Available On Host OS
- Viewing FlexAddress Mezzanine Card Fabric Connections
- Viewing or Terminating iDRAC Sessions
- Setting Up iDRAC Communication
- Communicating With iDRAC Through Serial Connection Using DB9 Cable
- Configuring BIOS For Serial Connection
- Enabling RAC Serial Connection
- Enabling IPMI Serial Connection Basic and Terminal Modes
- Switching Between RAC Serial and Serial Console While Using DB9 Cable
- Communicating With iDRAC Using IPMI SOL
- Communicating With iDRAC Using IPMI Over LAN
- Enabling or Disabling Remote RACADM
- Disabling Local RACADM
- Enabling IPMI on Managed System
- Configuring Linux for Serial Console During Boot
- Supported SSH Cryptography Schemes
- Communicating With iDRAC Through Serial Connection Using DB9 Cable
- Configuring User Accounts and Privileges
- Configuring Local Users
- Configuring Active Directory Users
- Prerequisites for Using Active Directory Authentication for iDRAC
- Supported Active Directory Authentication Mechanisms
- Standard Schema Active Directory Overview
- Configuring Standard Schema Active Directory
- Extended Schema Active Directory Overview
- Configuring Extended Schema Active Directory
- Extending Active Directory Schema
- Installing Dell Extension to the Active Directory Users and Computers Snap-In
- Adding iDRAC Users and Privileges to Active Directory
- Configuring Active Directory With Extended Schema Using iDRAC Web Interface
- Configuring Active Directory With Extended Schema Using RACADM
- Testing Active Directory Settings
- Configuring Generic LDAP Users
- Configuring iDRAC for Single Sign-On or Smart Card Login
- Prerequisites for Active Directory Single Sign-On or Smart Card Login
- Configuring iDRAC SSO Login for Active Directory Users
- Configuring iDRAC Smart Card Login for Local Users
- Configuring iDRAC Smart Card Login for Active Directory Users
- Enabling or Disabling Smart Card Login
- Configuring iDRAC to Send Alerts
- Managing Logs
- Monitoring and Managing Power
- Inventory, Monitoring, and Configuring Network Devices
- Inventory and Monitoring Network Devices
- Inventory and Monitoring FC HBA Devices
- Dynamic Configuration of Virtual Addresses, Initiator, and Storage Target Settings
- Managing Storage Devices
- Understanding RAID Concepts
- Supported Controllers
- Supported Enclosures
- Summary of Supported Features for Storage Devices
- Inventory and Monitoring Storage Devices
- Viewing Storage Device Topology
- Managing Physical Disks
- Managing Virtual Disks
- Managing Controllers
- Configuring Controller Properties
- Importing or Auto Importing Foreign Configuration
- Clearing Foreign Configuration
- Resetting Controller Configuration
- 12Gbps SAS HBA Adapter Operations
- Monitoring Predictive Failure Analysis On Drives
- Controller Operations in Non-RAID (HBA) Mode
- Running RAID Configuration Jobs On Multiple Storage Controllers
- Managing PCIe SSDs
- Managing Enclosures or Backplanes
- Choosing Operation Mode to Apply Settings
- Viewing and Applying Pending Operations
- Storage Devices — Apply Operation Scenarios
- Blinking or Unblinking Component LEDs
- Configuring and Using Virtual Console
- Supported Screen Resolutions and Refresh Rates
- Configuring Web Browsers to Use Virtual Console
- Configuring Virtual Console
- Previewing Virtual Console
- Launching Virtual Console
- Using Virtual Console Viewer
- Managing Virtual Media
- Installing and Using VMCLI Utility
- Managing vFlash SD Card
- Configuring vFlash SD Card
- Managing vFlash Partitions
- Using SMCLP
- Using iDRAC Service Module
- Using USB Port for Server Management
- Using iDRAC Quick Sync
- Deploying Operating Systems
- Troubleshooting Managed System Using iDRAC
- Using Diagnostic Console
- Viewing Post Codes
- Viewing Boot and Crash Capture Videos
- Viewing Logs
- Viewing Last System Crash Screen
- Viewing Front Panel Status
- Hardware Trouble Indicators
- Viewing System Health
- Generating Technical Support Report
- Checking Server Status Screen for Error Messages
- Restarting iDRAC
- Erasing System and User Data
- Resetting iDRAC to Factory Default Settings
- Frequently Asked Questions
- Use Case Scenarios
- Troubleshooting An Inaccessible Managed System
- Obtaining System Information and Assess System Health
- Setting Up Alerts and Configuring Email Alerts
- Viewing and Exporting Lifecycle Log and System Event Log
- Interfaces to Update iDRAC Firmware
- Performing Graceful Shutdown
- Creating New Administrator User Account
- Launching Server's Remote Console and Mounting a USB Drive
- Installing Bare Metal OS Using Attached Virtual Media and Remote File Share
- Managing Rack Density
- Installing New Electronic License
- Applying I/O Identity Configuration Settings for Multiple Network Cards in Single Host System Reboot

Monitoring Performance Index of CPU, Memory, and
I/O Modules
In 13
th
generation Dell PowerEdge servers, Intel ME provides support for Compute Usage Per Second (CUPS) functionality.
The CUPS functionality provides real-time monitoring of CPU, memory and I/O utilization and system-level utilization index for
the system. Since it is done by Intel ME, it is independent of the OS and does not consume CPU resources. The Intel ME
has a system CUPS sensor which provides the Computation, Memory and I/O resource utilization value as CUPS Index. iDRAC
monitors this CUPS index for the overall system utilization and also monitors the instantaneous value of CPU, Memory, and I/O
utilization index.
Utilization information of system resources is obtained by querying the data from a set of dedicated counters provided by the
CPU and chipset. These counters are called Resource Monitoring Counters or RMCs. These counters are aggregated by the
node manager to measure the cumulative utilization of each of these system resources that is read from the iDRAC using
existing inter-communication mechanisms to provide these vital data through out-of-band management interfaces.
Since Intel sensor representation of performance parameters and index values are for complete physical system, performance
data representation on the interfaces is for the complete physical system, even if the system is virtualized and hosting multiple
virtual hosts.
To display the performance parameters, the supported sensors must be present in the server.
The four system utilization parameters are:
● CPU Utilization - There are individual Resource Monitoring counters (RMCs) for each CPU core which are aggregated to
provide cumulative utilization of all the cores in the system. This utilization is based on time spent in active state and time
spent in inactive state. Each sample of RMC is taken every six seconds.
● Memory Utilization - There are individual counters (RMCs) to measure memory traffic occurring at each memory channel
or memory controller instance. These counters are aggregated to measure the cumulative memory traffic across all the
memory channels on the system. This is a measure of memory bandwidth consumption and not amount of memory
utilization. iDRAC aggregates it for one minute of period, so it may or may not match the memory utilization shown by
other OS tools such as TOP in Linux. Memory bandwidth utilization shown by iDRAC is indication of whether workload is
memory intensive or not.
● I/O Utilization - There are individual Resource Monitoring Counters (RMCs), one per root port in the PCI Express Root
Complex to measure PCI Express traffic emanating from or directed to that root port and the lower segment. These
counters are then aggregated to measure PCI express traffic for all PCI Express segments emanating from the package. This
is measure of IO bandwidth utilization for the system.
● System Level CUPS Index - The CUPS index is calculated by aggregating CPU, Memory, and I/O index considering a
pre-defined load factor of each system resource. The load factor depends on the nature of the workload run on the system.
Thus at any given time, CUPS Index represents the measurement of the compute headroom available on the server. Hence,
if the system has a large CUPS Index, then there is limited headroom to place additional workload on that system. As the
resource consumption decreases, the system’s CUPS Index decreases. A low CUPS Index indicates that there is a large
amount of compute headroom and the server is a main target for receiving new workloads or having the workload migrated,
and the server being placed into a lower power state in order to reduce power consumption. Such workload monitoring can
then be applied throughout the data center to provide a high-level and holistic view of the datacenter’s workload, providing a
dynamic datacenter solution.
NOTE:
The CPU, memory, and I/O utilization indexes are aggregated over one minute. Therefore, if there are any
instantaneous spikes in these indexes, they may be suppressed. They are indication of workload patterns not the amount of
resource utilization.
The IPMI, SEL, and SNMP traps are generated if the thresholds of the utilization indexes are reached and the sensor events are
enabled. The sensor event flags are disabled by default. It can be enabled using the standard IPMI interface.
The required privileges are:
● Login privilege is required to monitor performance data.
● Configure privilege is required for setting warning thresholds and reset historical peaks.
● Login privilege and Enterprise license is required for reading historical statics data.
Monitoring Performance Index for of CPU, Memory, and I/O
Modules Using Web Interface
To monitor the performance index of CPU, memory, and I/O modules, in the iDRAC Web interface, go to Overview >
Hardware. The Hardware Overview page displays the following:
Viewing iDRAC and Managed System Information
93