
Install Guide
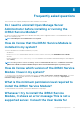


I used the remote iDRAC hard reset feature to
reset the iDRAC. However, the IPMI drives is
unresponsive and I am not able to troubleshoot.
If you try to use the remote iDRAC hard reset feature on VMware ESXi 5.5 U3 or ESXi 6.0 U1, the IPMI drivers becomes unresponsive,
because of this the iDRAC Service Module communication is stopped. You may have to reboot the server and load the IPMI driver again to
resolve the issue.
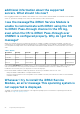
Where do I find the Replicated LifeCycle log on my
Operating System?
To view the replicated LifeCycle logs:
Table 8. Frequently asked question
Operating System Location
Microsoft Windows
Event viewer > Windows Logs >
<Existing group or Custom
folder>
. All the iDRAC Service Module LifeCycle logs are replicated
under the source name iDRAC Service Module.
Microsoft Windows Nano OS
You can view the replicated LifeCycle logs using the WMI or Windows
PowerShell query:Get-CimInstance –Namespace root/
cimv2 –className win32_NTLogEvent. By default, the logs
are available at Event viewer > Applications and Services Logs >
Hardware Events.
Red Hat Enterprise Linux, SUSE Linux, CentOS, and Citrix
XenServer
/var/log/messages
VMware ESXi /var/log/syslog.log
What is the default SNMP protocol configured in
iDRAC Service Module to send alerts in Linux
operating systems?
By default, the SNMP multiplexing protocol (SMUX) is configured in iDRAC Service Module to send alerts.
SMUX is not supported on my system. Which
protocol should I configure to send alerts?
If SMUX is not supported on your system, Agent-x is used as a default protocol.
How do I configure iDRAC Service Module to use
the Agent-x protocol to send alerts by default?
You can configure Agent-x as the default protocol using ./Enable-iDRACSNMPTrap.sh 1/agentx –force command. If –force
is not specified, ensure that the net-SNMP is configured and restart the snmpd service.
Frequently asked questions
29