
Users Guide


308 Recovering and Troubleshooting the Managed System
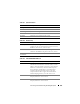
Using the System Event Log (SEL)
The SEL page displays system-critical events that occur on the managed
system.
To view the System Event Log:
1
In the
System
tree, click
System
.
2
Click the
Logs
tab and then click
System Event Log
.
The
System Event Log
page displays the event severity and provides other
information as shown in Table 20-7.
3
Click the appropriate
System Event Log
page button to continue
(see Table 20-7).
Table 20-7. Status Indicator Icons
Icon/Category Description
A green check mark indicates a healthy (normal) status condition.
A yellow triangle containing an exclamation point indicates a
warning (noncritical) status condition.
A red X indicates a critical (failure) status condition.
A question mark icon indicates that the status is unknown.
Date/Time The date and time that the event occurred. If the date is blank, then
the event occurred at System Boot. The format is mm/dd/yyyy
hh:mm:ss, based on a 24-hour clock.
Description A brief description of the event
Table 20-8. SEL Page Buttons
Button Action
Print Prints the SEL in the sort order that it is displayed in the window.
Refresh Reloads the SEL page.
Clear Log Clears the SEL.
NOTE: The Clear Log button is displayed only if you have Clear Logs
permission.