
White Papers


Ready Specs
3
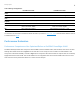
Table 2 Storage Configurations
Dell EMC Isilon F800
Dell EMC Isilon H600
Number of
nodes
4
4
CPU per node
Intel® Xeon™ CPU E5-2697A v4 @2.60 GHz
Intel® Xeon™ CPU E5-2680 v4 @2.40GHz
Memory per
node
256GB
256GB
Storage
Capacity
Total usable space: 166.8 TB, 41.7 TB per node
Total usable space: 126.8 TB, 31.7 TB per node
SSD L3 Cache
N/A
2.9 TB per node
Network
Front end network: 40GbE
Back end network: 40GbE
Front end network: 40GbE
Back end network: IB QDR
OS
Isilon OneFS v8.1.0 DEV.0
Isilon OneFS v8.1.0.0 B_8_1_0_011
The test data is the recommend standard benchmark data which is presented in Wong et al., 2014. This Plasmodium ribosome data set
is download from the ftp site.
Performance Evaluation
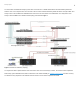
Performance Comparisons of the Optimized Relion on Dell EMC PowerEdge C6420
Dell EMC PowerEdge C6420s were configured as listed in Table 1, and two Dell EMC Isilons, F800 and H600, were used for the tests.
Although Intel’s results shown here in Figure 2 from the tests with a Lustre storage, we were not able to test with Dell EMC Lustre
Storage due to the limited availability. As shown in Figure 2, the running times with various numbers of compute nodes are consistently
slightly faster than the Intel’s results. This is small variations in our configurations such as Xeon® Gold 6148F instead of non-F series
CPUs Intel used and the performance differences in Lustre and Isilon storages.