
White Papers
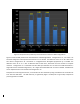


Figure 2: HPL performance, efficiency and acceleration on the five C4130 configurations.
Figure 2 shows the HPL performance characterization of PowerEdge C4130. Configurations “A”, “B” and “C” are
four GPU configurations with performance from 6.5 to 7.3 TFLOPS. The difference from “A” to “B” is due to the
extra CPU in configurations “B”. Overall the “C” configuration has the highest performance of 7.3 TFLOPS. The
difference from “B” to “C” is due to different GPU to CPU ratios; both have the same number of compute
resources. Configuration “C” is balanced with two GPUs per CPU while “B” has the all four GPU attached to a
single CPU. On the two GPU configurations, “D” is higher with 3.8 TFLOPS and “E” with 3.6 TFLOPS. The difference
can be explained due to one less CPU with configuration “E”.
Compared to a CPU-only performance, an acceleration of 9X is obtained by using four K80 and an acceleration of
4.7X with two K80 GPUs. The HPL efficiency is significantly higher on K80 (low to upper 80s) compared to
previous generation of GPUs.