
White Papers


10
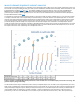
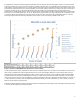
Figure 5. BWA-GATK performance results comparison between F800 and H600.
Plotting genomes/day throughput versus sample size for the F800 and H600 shows that performance on both platforms scales similarly
up to 128 samples (Figure 5). Past that, H600 performance levels off and then deteriorates while F800 performance continues to
improve. Future tests will utilize more than 64 compute nodes in an attempt to maximize pipeline throughput on the F800.
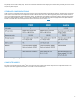
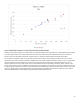
We can provide a comparison when running the same genome data set using a Lustre filesystem instead of Isilon. In this case, 80
samples were run using 40 compute nodes with 2 samples/node on the Lustre filesystem described in Table 1
2,5
. This run configuration
was also completed on the H600 (Figure 4). The total run time and genomes/day results were nearly identical (Figure 6). The run
finished 4 minutes faster on the Lustre system to give it the smallest advantage in calculating genomes/day; H600 = 164.38, Lustre =
165.37. An 80 sample run was not completed using the F800, but if we average the results from the 64 and 104 samples runs, 136 and
219 genomes/day, respectively, we arrive at 177 genomes/day for 84 samples ((104 + 64)/2) on the F800, with an average of 42 nodes
used ((32 + 52)/2) running 2 samples/node. While not the most scientific of interpolations, this inference makes sense given that the
H600 and F800 performance scaled similarly up to approximately 128 samples (Figure 5).