
White Papers


15
The throughput of Dell EMC HPC System for Life Sciences
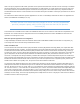
Total run time is the elapsed wall time from the earliest start of Phase 1, Step 1 to the latest completion of Phase 3, Step 2. Time
measurement for each step is from the latest completion time of the previous step to the latest completion time of the current step as
illustrated in Figure 6.
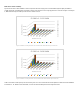
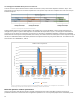
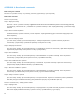
Feeding multiple samples into an analytical pipeline is the simplest way to increase parallelism, and this practice will improve the
throughput of a system if a system is well-designed to accommodate the sample load. In Figure 7, the throughput in total number of
genomes per day for all tests are summarized. As expected, it is clear that the C6320/OPA combination outperform the FC430/FDR
combination due to CPU higher memory bandwidth, faster memory and a faster interconnect. Although the run time depends heavily on
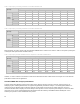
the data, the C6320/OPA solution shows better performance throughout the whole range of genome data sizes. The detailed run time
measurements are in APPENDIX C, Table 8.
Molecular dynamics software performance
Over the past decade, GPUs became popular in scientific computing because of their great ability to exploit a high degree of
parallelism. NVIDIA has a handful of life sciences applications optimized to run on their general purpose GPUs. Unfortunately, these
Figure 6: Running time measurement method
0
50
100
150
200
250
300
350
400
450
500
Human
13x (1.24)
Human
52x (1.31)
Cow 12x
(1.33)
Rice 30x
(1.17)
Rice 132x
(1.17)
Pig 8x
(1.59)
Pig 14x
(1.95)
Corn 11x
(1.54)
165
55
109
469
104
140
107
86
133
42
82
402
89
88
55
56
Genomes Per Day
Species & Data Size (Speed-up)
BWA-GATK Pipeline
C6320/OPA FC430/FDR
Figure 7: Number of genomes processed through BWA-GATK pipeline: the comparisons are between
PowerEdge C6320 with Intel® OPA and PowerEdge FC430 with IB FDR