
White Papers


o Best Practices Phase 1: Pre-processing
o Best Practices Phase 2A: Calling germline variants
o Best Practices Phase 2B: Calling somatic variants
o Best Practices Phase 3: Preliminary analyses
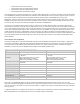
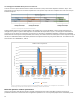
Here we tested phase 1, phase 2A and phase 3 for a germline variant calling pipeline. The details of commands used in the benchmark
are in APPENDIX A. GRCh37 (Genome Reference Consortium Human build 37) was used as a reference genome sequence, and 10x
whole human genome sequencing data from the Illumina platinum genomes project, named ERR091571_1.fastq.gz and
ERR091571_2.fastq.gz11 were used for a baseline test [13]. Further tests with 50x coverage whole genomes were done to check for
scalability of the solution as the data size increased. In addition to human genome, other mammal and plants genomes from cow, pig,
rice and corn were also tested. The details of the datasets are mentioned in APPENDIX B.
It is ideal to use non-identical sequence data for each run. However, it is extremely difficult to collect non-identical sequence data
having more than 30x depth of coverage from the public domain. Hence, we used a single sequence data set for multiple simultaneous
runs. A clear drawback of this practice is that the running time of Phase 2, Step 2 might not reflect the true running time as researchers
tend to analyze multiple samples together. Also, this step is known to be less scalable. The running time of this step increases as the
number of samples increases. A subtle pitfall is a storage cache effect. Since all the simultaneous runs will read/write roughly at the
same moment, the run time would be shorter than real cases. Despite these built-in inaccuracies, this variant analysis performance test
can provide valuable insights to estimating how many resources are required for an identical or even similar analysis pipeline with a
defined workload.
Variant Analysis test configuration
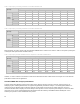
Two different configurations, Intel® OPA and IB FDR were used to benchmark BWA-GATK pipeline variant analysis. In Table 5, the
configuration of PowerEdge C6320 with Intel® OPA and FC430 with IB FDR solutions are summarized. Processors on both solutions
are nearly identical, except Intel® Xeon® Dual E5-2697 v4 has more cores, higher max turbo frequency and better max memory
bandwidth. The same versions of all applications were installed on both platforms before testing.
Table 5: Test configurations for Genomics/NGS data analysis
Component
C6320/OPA
FC430/FDR
Server
40x PowerEdge C6320
40x PowerEdge FC430 in FX2 chassis
Processor
Total 1440 cores; Intel® Xeon® Dual E5-2697 v4
- 18 cores
Processor base frequency: 2.30 GHz
Max turbo frequency: 3.60 GHz
Max memory bandwidth: 76.8 GB/s
Total of 1120 cores: Intel® Xeon® Dual E5-2695 v3
- 14 cores
Processor base frequency: 2.30 GHz
Max turbo frequency: 3.30 GHz
Max memory bandwidth: 68 GB/s
Memory
128GB-8x16GB DIMM, 2400 MT/s, dual rank, x4
data width
128GB - 8x 16GB RDIMM, 2133 MT/s, dual rank, x4
data width
Storage
480TB IEEL (Lustre)
480TB IEEL (Lustre)
Interconnect
Intel® OPA
IB FDR
OS
Red Hat Enterprise 7.2
Red Hat Enterprise 6.6
Cluster Management tool
Bright Cluster Manager 7.2
Bright Cluster Manager 7.1
Snoop Mode
opportunistic snoop broadcast
early snoop
Short Sequence Aligner
BWA 0.7.2-r1039
BWA 0.7.2-r1039
Variant Analysis
GATK 3.5
GATK 3.5
Utilities
sambamba 0.6.0, samtools 1.2.1
sambamba 0.6.0, samtools 1.2.1
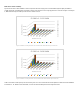
Each node in the C6320/OPA solution has 36 cores whereas FC430/FDR solution provides 28 cores for each node. For a fair
comparison, two BWA-GATK pipelines are loaded on each node and any sub process uses 13 cores at most. Hence, a maximum of 26
cores are used at any one moment in each node on both solutions. In addition to CPU usage, an equal amount of memory is allocated
for every process.
The pipeline tested here is not optimized for any system, and default values are used when it is allowed. A total of 80 processes of
BWA-GATK pipelines are run simultaneously in each test and results output to Lustre storage.