
Troubleshooting
Improving Oracle OLTP database performance with Dell Fluid Cache for DAS
iv
Table 5. Virtual Disk configuration for Fluid Cache based solution. ....................................... 23
Table 6. Software Versions ........................................................................................ 23
Table 7. ASM disk group configuration for the baseline ...................................................... 28
Table 8. ASM disk group configuration for the Fluid Cache based solution ............................... 29
Table 9. Kernel parameters settings for Oracle database ................................................... 29
Table 10. Database parameter settings .......................................................................... 30
Figures
Figure 1. Architecture: Baseline configuration ................................................................... 8
Figure 2. Architecture: Fluid Cache based storage solution .................................................. 10
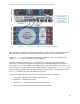
Figure 3. Performance benchmarking architecture ............................................................ 11
Figure 4. Performance graph: TPS behavior spanning entire test duration ............................... 15
Figure 5. Performance graph: ART behavior spanning entire test duration ............................... 15
Figure 6. Performance graph: CPU Utilization - IOWaits ...................................................... 16
Figure 7. Performance graph: Total CPU Utilization .......................................................... 17
Figure 8. Performance graph: Max TPS performance .......................................................... 18
Figure 9. Performance graph: Average response time (ART) at 3100 user load .......................... 18
Figure 10. Performance graph: Max user load with 2secs ART SLA ........................................... 19