
Troubleshooting

Improving Oracle OLTP database performance with Dell Fluid Cache for DAS
18
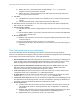
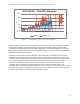
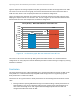
Performance graph: Max TPS performance Figure 8.
Figure 8 compares the max TPS performance of the baseline and the Fluid Cache based solution. As can
be seen from that graph, Fluid Cache based solution delivers 60% more TPS than the baseline
configuration.
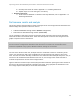
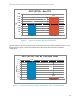
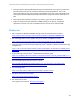
Performance graph: Average response time (ART) at 3100 user load Figure 9.
983
1577
0
200
400
600
800
1000
1200
1400
1600
1800
Baseline Fluid Cache
TPS
OLTP (R720) - Max TPS
60%
1.712
0.09
0
0.2
0.4
0.6
0.8
1
1.2
1.4
1.6
1.8
Baseline Fluid Cache
ART (sec)
OLTP (R720) - ART at 3100 User Load
95%