
Troubleshooting

Improving Oracle OLTP database performance with Dell Fluid Cache for DAS
16
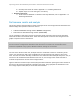
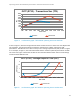
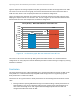
The CPU utilization captured during the benchmarking tests using the OSWatcher tool helps to further
investigate the cause of the sharp increase in the ART. As seen in Figure 6, the peak CPU IOWait for the
baseline configuration is around 60%, while the peak CPU IOWait for the Fluid Cache based solution is
around 10%. A high CPU IOWait typically indicates that the CPU is waiting on the backend storage I/O
to finish. This high IOWait behavior is observed in case of the baseline configuration because the
backend spinning disks, with its limited IOPS capability, cannot complete the increasing number of
transactions without the increase in response time. This confirms that the backend storage eventually
becomes the bottleneck in the case of the baseline configuration.
Performance graph: CPU Utilization - IOWaits Figure 6.
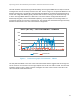
The 10% peak CPU IOWait in the case of the Fluid Cache based solution suggests that the storage was
not the cause for the increase in the average response time as the user load increased. The total CPU
utilization graph in Figure 7 helps to further investigate the cause of the increase in the ART in the
case of the Fluid Cache based solution.
0
20
40
60
80
100
%
Increasing User Load -->
OLTP (R720) - CPU Utilization - IOWaits
Baseline Fluid Cache