
Troubleshooting

Improving Oracle OLTP database performance with Dell Fluid Cache for DAS
15
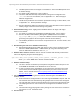
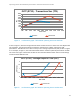
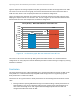
Performance graph: TPS behavior spanning entire test duration Figure 4.
As seen in Figure 4, both the storage solutions deliver similar TPS until a certain user load. Beyond that
user load point, the TPS performances for both the solutions start to differ and hit their peak
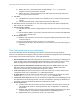
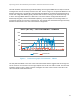
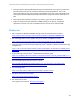
performance. This behavior occurs due to a sharp rise in average response time (ART) as seen in Figure
5. For example, in Figure 4, the Fluid Cache based solution reaches its peak TPS performance at 3200
user load. And, Figure 5 shows that the ART for the Fluid Cache based solution starts to climb sharply
around the same 3200 user load.
Performance graph: ART behavior spanning entire test duration Figure 5.
0
200
400
600
800
1000
1200
1400
1600
1800
500 900 1300 1700 2100 2500 2900 3300 3700 4100 4500
TPS
User Load
OLTP (R720) - Transactions/Sec (TPS)
Baseline Fluid Cache
0
0.5
1
1.5
2
500 900 1300 1700 2100 2500 2900 3300 3700 4100 4500
ART (secs)
User Load
OLTP (R720) - Average Response Time (ART)
Baseline Fluid Cache