
Users Guide
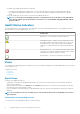

1. In the OpsMgr console, click Monitoring.
2. In the Monitoring pane, navigate to the Dell folder.
3. Expand Alerts Views > EqualLogic Device Alerts.
The OpsMgr console displays the alerts for all the arrays that you are monitoring in the EqualLogic Device Alerts pane. These alerts
meet the criteria you specified in the Authoring pane, such as severity, resolution state, age, or alerts that are assigned to you.
4. Select an alert to view the details in the Alert Details pane.
Using the Custom Field for SNMP Alerts
To view the SNMP alerts received from an EqualLogic group or member, you can use Custom Field 1. Custom Field 1 is a combination
of the EqualLogic group name and the EqualLogic member name that is added to each alert. You can sort the Alerts Views on this field to
list the alerts that belong to a particular EqualLogic group.
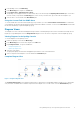
Diagram Views
The Diagram views offers a hierarchical and graphical representation of all Dell EqualLogic devices discovered and monitored by the Dell
EqualLogic Storage Management Pack. The Diagram Views displays icons for the various components of the Dell EqualLogic group.
Viewing Diagrams in the OpsMgr Console
To view the diagrams on the OpsMgr console:
1. Launch the OpsMgr console and click Monitoring.
2. In the Monitoring pane on the left side, navigate to the Dell folder.
3. Expand Diagram Views. The options available are:
• Complete Diagram View
• EqualLogic Diagram View
4. Select any of the options.
The right pane displays the hierarchical and graphical representation of the selected Dell device.
5. Select a component in the diagram to view the details in the Detail View pane.
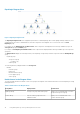
Complete Diagram View
Figure 1. Complete Diagram View
The Complete Diagram View offers a graphical representation of all Dell devices that OpsMgr manages, and allows you to expand and
verify the status of individual devices and their components in the diagram. The root node for this view is the Dell Hardware group.
Using Dell EqualLogic Storage Management Pack Suite
9