
Users Guide
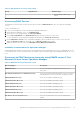
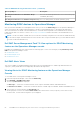
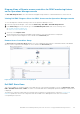
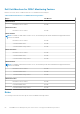
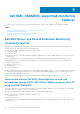
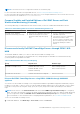

Diagram Views of Remote access controllers for DRAC monitoring feature
on the Operations Manager console
The Dell EMC Diagram Views offers a hierarchical and graphical representation of all Dell DRAC devices on the network.
Viewing Dell EMC Diagrams Views for DRAC feature on the Operations Manager console
To view the diagrams for DRAC monitoring feature on the Operations Manager console:
1. Launch the Operations Manager console and click Monitoring > Dell EMC > Dell EMC Diagram Views.
2. In the Monitoring pane on the left side, go to the Dell EMC Diagram Views folder for the following views:
● Dell EMC Complete Diagram View
● Remote Access Controllers Group
3. Select any of the Diagram Views.
On the right pane the hierarchical and graphical representation of the selected Dell device is displayed.
4. Select a component in the diagram to view its details in the Detail View pane.
Remote Access Controllers Group
The Remote Access Controllers Group diagram view offers a graphical representation of all iDRAC6, iDRAC7, and iDRAC8
devices. Select a component in the diagram to view its details in the Detail View pane.
Figure 6. Remote Access Controllers Group Diagram
Dell EMC State Views
This view is available for viewing the health of the DRAC devices. In the Operations Manager console, click Monitoring > Dell
EMC > Dell EMC State Views > DRAC, the status of each Dell DRAC device managed by Operations Manager on the network
is displayed.
The health of a component is derived by reviewing the unresolved alerts associated with the component. Severity Level
Indicators explains the various state components that the Dell EMC Server Management Pack Suite uses with their
corresponding severity levels.
Dell EMC Server Management pack suite version 7.2 supported Monitoring features
63