
Users Guide

Disabled. To enable the Dell Server Capacity Check unit monitor, see the Enabling Dell Server Capacity Check unit
monitor.
The minimum threshold value is 1, and the maximum threshold value is 99. The default threshold value is 60. You can configure
the threshold values within the specified range i.e 1–99. In case, you provide a threshold value other than the specified ranges,
the default threshold value is considered.
A warning event per server is generated when the average system or CUPS usage for the last one day exceeds the configured
threshold value. The warning event is auto resolved when the average system or CUPS usage for the last one day returns within
the configured threshold value.
You can view the details of the warning alert in the Alert Details pane under Monitoring > Dell EMC > Dell EMC Alerts
Views > Dell EMC Server and Rack Workstation Alerts View.
You can view the health state obtained from the unit monitor; Dell Server Capacity Check under Monitoring > Dell
EMC > Dell EMC State Views > Dell EMC Servers (iSM) State View > Dell Server Capacity Threshold Check. You can
also view the component; Dell Server Capacity Threshold Capacity Check under the Dell Server Capacity object in
Diagram Views.
Capacity Planning feature also provides a performance graph to show the trend for the Average SYS Usage/Day.
To view the performance graph for the capacity planning feature:
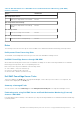
1. Click Monitoring > Dell EMC > Dell EMC Performance and Power Monitoring Views > Dell EMC System Board
Usage > Overall System Usage - iSM (%).
2. Select Capacity Check System Board Average Sys Usage(last day) under the Counter column for the desired Dell
EMC device and select the time range for the values required
.
The data collected is represented in a graphical format for the selected Dell EMC device.
This feature is available for Dell EMC PowerEdge servers discovered through both, the iDRAC and iSM methods of Server and
Rack Workstation Monitoring (Licensed) feature.
iDRAC detection of failed CMC/OME-M
Using the feature; iDRAC detection of a failed Dell EMC Chassis Management Controller/OpenManage Enterprise Modular
(CMC/OME-M) , the iDRAC of a Rack Style Management (RSM) enabled modular server detects a failed or an unavailable
chassis controller. By using this feature, you can take immediate remedial action to bring the failed Dell EMC CMC/OME-M to a
normal state.
The Dell Chassis Controller Sensor indicates the presence or failure of a Dell EMC CMC/OME-M.
You can view the health state obtained from the unit monitor; Dell Chassis Controller Sensor under Sensors in Dell EMC
Diagram Views.
NOTE:
● The Dell Chassis Controller Sensor is available in both; Scalable and Detailed Management Pack.
● iDRAC detection of failed Dell EMC CMC/OME-M is supported for iDRAC 9-based PowerEdge FX2 Chassis only.
Server port connection information
Server port connection information feature provides details of the physical mapping of switch ports to server ports, and iDRAC
dedicated port connections. This feature helps you to reduce cabling error debugging by identifying which switch ports are
connected to a server’s network ports, and iDRAC dedicated port.
You can view the details of the Server port connection information under iDRAC NIC and NIC objects in the Detail View pane
of the Dell EMC Diagram View. Along with the inventory information of each NIC; chassis ID information of the switch and the
port ID information is populated.
This feature is available for Dell EMC PowerEdge servers that are discovered through both, the iDRAC and iSM methods of Dell
EMC Server and Rack Workstation Monitoring (Licensed) feature.
NOTE: This feature is supported for iDRAC 9-based PowerEdge servers only.
Dell EMC Server Management pack suite version 7.2 supported Monitoring features 53