
Users Guide
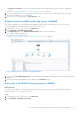

Table Of Contents
- Dell EMC Server Management Pack Suite Version 7.2 for Microsoft System Center Operations Manager User's Guide
- About Dell EMC Server Management Pack Suite (DSMPS) for SCOM
- Support Matrix for DSMPS
- Installing DSMPS
- Discover and manage PowerEdge servers on the SCOM console by using the monitoring feature of DSMPS
- Scalable and detailed editions of DSMPS monitoring for PowerEdge servers and rack workstations
- Discovery and classification of PowerEdge servers and rack workstations
- Discover PowerEdge servers by using SCOM Agent Management
- Monitoring Dell EMC PowerEdge Servers in the SCOM console
- View options for Dell EMC Server and Rack Workstation monitoring feature of DSMPS
- Alert view in the monitoring feature of DSMPS for PowerEdge servers and rack workstations
- Diagram views in the monitoring feature of DSMPS for PowerEdge servers and rack workstations
- Performance and power monitoring views in the monitoring feature of DSMPS for PowerEdge servers and rack workstations
- State views in the monitoring feature of DSMPS for PowerEdge servers and rack workstations
- View options for Dell EMC Server and Rack Workstation monitoring feature of DSMPS
- Discover and manage PowerEdge servers on the SCOM console by using iSM-WMI
- _
- Scalable and Detailed editions of DSMPS monitoring for PowerEdge servers and rack workstations using iSM-WMI
- Discovery and classification of PowerEdge servers and rack workstations using iSM-WMI
- Prerequisites for discovering PowerEdge servers by using iSM-WMI
- Discover PowerEdge servers by using iSM-WMI
- Monitoring features for PowerEdge servers and rack workstations in DSMPS using iSM-WMI
- Discover and manage DRACs on the SCOM console by using DSMPS
- Supported tasks on the SCOM console for DSMPS monitoring features
- Run DSMPS monitoring feature-based tasks on SCOM
- Tasks run on Dell EMC devices by using the DSMPS monitoring features
- Check connection to the nodes
- View warranty information of PowerEdge servers
- Start OMSA on monolithic servers using the SCOM console
- Start iDRAC using the SCOM console
- Start Remote Desktop on monolithic servers using the SCOM console
- Perform a remote iDRAC hard reset operation
- Clear Embedded Server Management (ESM) logs
- Power management-related tasks
- Generating DSMPS reports
- Upgrading DSMPS
- Uninstalling DSMPS
- Reference topics
- Monitoring features supported by DSMPS
- Dell EMC Server and Rack Workstation Monitoring feature in DSMPS using OMSA
- Dell EMC Server and Rack Workstation Monitoring feature using iSM-WMI
- DRAC Monitoring feature of DSMPS
- Configuring the monitoring features of DSMPS by using the Feature Management Dashboard
- Import monitoring features using the Dell EMC Feature Management Dashboard
- Upgrade monitoring features using the Dell EMC Feature Management Dashboard
- Customizing monitoring features using the Feature Management Dashboard for scalable and detailed editions
- Remove monitoring features using the Dell EMC Feature Management Dashboard
- Import management packs to the SCOM console
- Severity levels of discovered devices
- Discovery features supported in the DSMPS monitoring of PowerEdge servers and rack workstations using OMSA
- Discovery features supported by DSMPS for monitoring DRACs
- Hardware components monitored by different monitoring features of DSMPS
- View options provided by the monitoring features of DSMPS
- Key features of monitoring PowerEdge servers in DSMPS using iSM-WMI
- DSMPS Unit Monitors
- Event rules used by different monitoring features of DSMPS
- Monitoring features supported by DSMPS
- Troubleshooting
- Data is not displayed on the Feature Management Dashboard
- A task run on the Feature Management Dashboard fails
- Feature Management alerts
- The Management Server (MS) is not functioning, and therefore, tasks associated with it cannot be completed (Health Service of the Feature Management Host Server is nonfunctional)
- Additional resources
- Accessing support content from the Dell EMC support site
- Contacting Dell Technologies
- Glossary
- Additional topics
- Identify device and device power status by using identification LEDs
- Migrate from Dell Server Management Pack Suite Version 6.0 for Microsoft SCOM
- Configure SCOM to monitor traps and trap-based unit monitors
- Create Run-As-Account for SNMP monitoring
- Associate multiple Run-As accounts
- Install Web Services Management (WS-Man) and SMASH device template
- Associate Run-As Account task—Dell EMC Server and Rack Workstation Monitoring feature

Discover and enable DRAC devices using DSMPS
About this task
The DRAC devices must be discovered as network devices under the Administration section of the SCOM console. To
discover DRAC devices in the SCOM console, do the following:
Steps
1. Log in to the management server as a SCOM administrator.
2. In the left pane, select Administration.
3. In the left pane, click Discovery Wizard.
4. Select Network devices, and then complete the tasks that are prompted by the Computer and Device Management
Wizard.
For more information, see the Microsoft SCOM documentation.
5. On the Add a Device Console screen, enter the IP address that you want to discover.
6. Select the necessary Run As Account from the SNMP V1 or SNMP V2 Run As Account drop-down menu.
7. Enable the DRAC monitoring feature by using the Dell EMC Feature Management Dashboard.
Results
Scalability recommendation for SCOM
When managing large number of network devices in a distributed setup, use dedicated resource pools of Management Servers
for each device type. For more information about the number of devices that are supported in a Management Group, see the
Sizing Guide sections in the Microsoft SCOM documentation.
Monitoring DRACs using DSMPS
After you install DSMPS, you can use the Monitoring pane of SCOM to select views that provide complete health information
of the discovered Dell DRAC devices. The DRAC monitoring feature discovers and monitors the health of the Dell DRAC devices.
It includes monitoring health of the Dell DRAC devices, both at regular intervals and on occurrence of events. The Severity
levels of discovered devices on page 42 indicates the health of the Dell DRAC devices on the network.
NOTE:
To monitor the health of DRAC devices, associate the community string Run As account with the SNMP Monitoring
Account with the target as the Dell Remote Access Controller class or respective DRAC object (if you have different Run As
accounts for different DRAC devices).
View options for DRAC monitoring feature of DSMPS
DSMPS provides the following types of views for monitoring DRACs by selecting Monitoring > Dell EMC on the SCOM
console:
● Alert view in the monitoring feature of DSMPS using iSM-WMI on page 19
● Diagram views in the monitoring feature of DSMPS using iSM-WMI on page 19
● Performance and power monitoring views in the monitoring feature of DSMPS using iSM-WMI on page 19
● State views in the monitoring feature of DSMPS using iSM-WMI on page 20
Alert view in the DRAC monitoring feature of DSMPS
The Alert View is available for managing hardware and storage events from Dell EMC DRAC devices. SNMP traps and Platform
Event Traps (PET) sent by DRAC devices are displayed by the DRAC monitoring feature.
To view DRAC alerts on the SCOM console:
1. In the left pane of the SCOM console, select Monitoring.
2. Expand Dell EMC > Dell EMC Alerts Views. The following alerts are displayed:
● PET Traps—These alerts contain information about PET traps from iDRAC6, iDRAC7, and iDRAC8 devices.
22
Discover and manage DRACs on the SCOM console by using DSMPS