
Users Guide
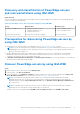
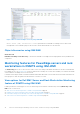
Table Of Contents
- Dell EMC Server Management Pack Suite Version 7.2 for Microsoft System Center Operations Manager User's Guide
- About Dell EMC Server Management Pack Suite (DSMPS) for SCOM
- Support Matrix for DSMPS
- Installing DSMPS
- Discover and manage PowerEdge servers on the SCOM console by using the monitoring feature of DSMPS
- Scalable and detailed editions of DSMPS monitoring for PowerEdge servers and rack workstations
- Discovery and classification of PowerEdge servers and rack workstations
- Discover PowerEdge servers by using SCOM Agent Management
- Monitoring Dell EMC PowerEdge Servers in the SCOM console
- View options for Dell EMC Server and Rack Workstation monitoring feature of DSMPS
- Alert view in the monitoring feature of DSMPS for PowerEdge servers and rack workstations
- Diagram views in the monitoring feature of DSMPS for PowerEdge servers and rack workstations
- Performance and power monitoring views in the monitoring feature of DSMPS for PowerEdge servers and rack workstations
- State views in the monitoring feature of DSMPS for PowerEdge servers and rack workstations
- View options for Dell EMC Server and Rack Workstation monitoring feature of DSMPS
- Discover and manage PowerEdge servers on the SCOM console by using iSM-WMI
- _
- Scalable and Detailed editions of DSMPS monitoring for PowerEdge servers and rack workstations using iSM-WMI
- Discovery and classification of PowerEdge servers and rack workstations using iSM-WMI
- Prerequisites for discovering PowerEdge servers by using iSM-WMI
- Discover PowerEdge servers by using iSM-WMI
- Monitoring features for PowerEdge servers and rack workstations in DSMPS using iSM-WMI
- Discover and manage DRACs on the SCOM console by using DSMPS
- Supported tasks on the SCOM console for DSMPS monitoring features
- Run DSMPS monitoring feature-based tasks on SCOM
- Tasks run on Dell EMC devices by using the DSMPS monitoring features
- Check connection to the nodes
- View warranty information of PowerEdge servers
- Start OMSA on monolithic servers using the SCOM console
- Start iDRAC using the SCOM console
- Start Remote Desktop on monolithic servers using the SCOM console
- Perform a remote iDRAC hard reset operation
- Clear Embedded Server Management (ESM) logs
- Power management-related tasks
- Generating DSMPS reports
- Upgrading DSMPS
- Uninstalling DSMPS
- Reference topics
- Monitoring features supported by DSMPS
- Dell EMC Server and Rack Workstation Monitoring feature in DSMPS using OMSA
- Dell EMC Server and Rack Workstation Monitoring feature using iSM-WMI
- DRAC Monitoring feature of DSMPS
- Configuring the monitoring features of DSMPS by using the Feature Management Dashboard
- Import monitoring features using the Dell EMC Feature Management Dashboard
- Upgrade monitoring features using the Dell EMC Feature Management Dashboard
- Customizing monitoring features using the Feature Management Dashboard for scalable and detailed editions
- Remove monitoring features using the Dell EMC Feature Management Dashboard
- Import management packs to the SCOM console
- Severity levels of discovered devices
- Discovery features supported in the DSMPS monitoring of PowerEdge servers and rack workstations using OMSA
- Discovery features supported by DSMPS for monitoring DRACs
- Hardware components monitored by different monitoring features of DSMPS
- View options provided by the monitoring features of DSMPS
- Key features of monitoring PowerEdge servers in DSMPS using iSM-WMI
- DSMPS Unit Monitors
- Event rules used by different monitoring features of DSMPS
- Monitoring features supported by DSMPS
- Troubleshooting
- Data is not displayed on the Feature Management Dashboard
- A task run on the Feature Management Dashboard fails
- Feature Management alerts
- The Management Server (MS) is not functioning, and therefore, tasks associated with it cannot be completed (Health Service of the Feature Management Host Server is nonfunctional)
- Additional resources
- Accessing support content from the Dell EMC support site
- Contacting Dell Technologies
- Glossary
- Additional topics
- Identify device and device power status by using identification LEDs
- Migrate from Dell Server Management Pack Suite Version 6.0 for Microsoft SCOM
- Configure SCOM to monitor traps and trap-based unit monitors
- Create Run-As-Account for SNMP monitoring
- Associate multiple Run-As accounts
- Install Web Services Management (WS-Man) and SMASH device template
- Associate Run-As Account task—Dell EMC Server and Rack Workstation Monitoring feature
● IO Usage - iSM (%)
● Memory Usage - iSM (%)
● Overall System Usage - iSM (%)
4. Select the counters from the individual performance views and select the time range for which the values are required.
The data that is collected is represented in a graphical format for each system.
Next steps
A unit monitor monitors the performance counter over two successive cycles to check if it exceeds a threshold value. When
the threshold value is exceeded, the Dell EMC PowerEdge Server changes state and generates an alert. This unit monitor is
disabled by default. You can override (enable) the threshold values in the Authoring pane of the SCOM console. Unit monitors
are available under Dell Windows Server objects for the Dell EMC Server and Rack Workstation Monitoring feature. To enable
the threshold values of unit monitors, see Enable performance and power monitoring unit monitors on page 14.
To enable the PowerEdge server performance collection rules and for more information about the performance information
collection, see Enable PowerEdge server performance collection rules set on the SCOM console on page 14.
State views in the monitoring feature of DSMPS using iSM-WMI
About this task
The State View is available for viewing the health of Dell EMC devices that are monitored by different monitoring features of
DSMPS. To view the state of a device:
Steps
1. In the left pane of the SCOM console, select Monitoring.
2. Expand Dell EMC > Dell EMC State Views.
Different State views are listed based on the monitoring feature. See State views displayed by different monitoring features
of DSMPS on page 50.
3. To view data about a component, select a component.
Information is displayed in the Detail View section.
Results
The health of a component is derived by reviewing the unresolved alerts that are associated with the component. Severity levels
of discovered devices on page 42 explain the various state components that DSMPS use with their corresponding severity
levels.
20
Discover and manage PowerEdge servers on the SCOM console by using iSM-WMI