
Users Guide
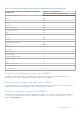
Table Of Contents
- Dell EMC OpenManage Integration Version 7.2 with Microsoft System Center for System Center Operations Manager User's Guide
- Contents
- About this guide
- About Dell EMC OpenManage Integration with Microsoft System Center (OMIMSSC) for System Center Operations Manager (SCOM)
- Purchase and manage OMIMSSC license
- Port information and Communication Matrix for OMIMSSC appliance
- Support Matrix
- Deploy and configure the OMIMSSC appliance
- OMIMSSC and SCOM interfaces for device management
- Enroll (register) management servers to OMIMSSC
- Tasks you can perform on the OMIMSSC Admin Portal
- Manage OMIMSSC from the SCOM console
- Discovery and monitoring of PowerEdge servers by using the licensed monitoring features of OMIMSSC
- Introduction to the licensed monitoring features in OMIMSSC for PowerEdge servers and rack workstations
- Discovery and classification of PowerEdge servers and workstations by using WS-Man or iDRAC access using Host operating system
- Prerequisites to discover PowerEdge Servers using Dell EMC Server and Rack Monitoring (Licensed)
- Discover PowerEdge servers by using iDRAC WS-Man through OMIMSSC
- Discover PowerEdge servers by using the SCOM console
- Object discoveries using WS-Man
- Install SNMP services to monitor PowerEdge servers
- Monitoring PowerEdge servers and rack workstations on the SCOM console
- Discovery and monitoring of Dell EMC chassis using OMIMSSC
- Discovery and monitoring of Dell EMC Network Switches using OMIMSSC
- Discovery and classification of network switches
- Override properties to customize the network switch discovery process
- Import network switch management packs for discovery from OMIMSSC Admin Portal
- Discover Dell EMC Network Switches by using OMIMSSC
- Discover Dell EMC Network Switches by using SCOM
- Network Switches monitoring feature in OMIMSSC
- Manage Dell EMC devices using the OMIMSSC appliance
- View jobs in OMIMSSC Admin Portal and OpenManage Integration Dashboard
- Run tasks on the SCOM console for OMIMSSC monitoring features
- Run OMIMSSC monitoring feature-based tasks on SCOM
- Tasks run on Dell EMC devices by using the OMIMSSC monitoring features
- Check connection to the nodes
- View warranty information of PowerEdge servers
- Start OMSA on monolithic servers using the SCOM console
- Start iDRAC using the SCOM console
- Start Remote Desktop on monolithic servers using the SCOM console
- Perform a remote iDRAC hard reset operation
- Clear Embedded Server Management (ESM) logs
- Power management-related tasks
- Start the Dell CMC console
- Upgrading the OMIMSSC appliance
- De-enroll (Deregister) management servers enrolled to OMIMSSC
- Remove an OMIMSSC VM
- Troubleshooting
- After deploying the OMIMSSC appliance, an IP address is not assigned to the OMIMSSC appliance
- After deploying the OMIMSSC appliance, enrollment of management servers with OMIMSSC is unsuccessful or the management packs are not successfully installed.
- Unable to start the OpenManage Integration Dashboard in the SCOM console
- Unable to connect to the OMIMSSC appliance
- Issues observed when usernames of local account and domain account match but the passwords differ
- Resolve issues in synchronizing data of Dell EMC devices with OMIMSSC
- Manually clean the SCOM console that is unreachable during the de-enrollment
- Connection is unavailable between OMIMSSC and the SCOM console
- Unable to log in to the OMIMSSC Admin portal by using the Mozilla Firefox browser
- A job run on OMIMSSC to discover a device stays in the Progress state for more than five hours
- Unable to discover and monitor devices after restarting OMIMSSC
- Event ID 33333: Data Access Layer rejected retry on SqlError
- Resolve issues in the Dell EMC Feature Management Dashboard
- Reference topics
- Monitoring features supported by OMIMSSC
- Configuring the monitoring features of OMIMSSC by using the Feature Management Dashboard
- Import monitoring features using the Dell EMC Feature Management Dashboard
- Upgrade monitoring features using the Dell EMC Feature Management Dashboard
- Customizing monitoring features using the Feature Management Dashboard for scalable and detailed editions
- Remove monitoring features using the Dell EMC Feature Management Dashboard
- Severity levels of discovered devices
- Key features of licensed monitoring of PowerEdge servers in OMIMSSC
- System configuration lockdown mode in iDRAC9 PowerEdge servers
- iDRAC Group Manager in iDRAC9 PowerEdge servers
- Event auto resolution
- Capacity planning of PowerEdge servers discovered through iDRAC and iSM
- Detect and restore the status of a failed CMC or OpenManage Enterprise-Modular
- Port connection information of PowerEdge servers discovered through iDRAC and iSM
- Hardware components of servers and rack workstations monitored by OMIMSSC
- Hardware components of chassis monitored by OMIMSSC
- Hardware components of network switches monitored by OMIMSSC
- View options provided by the OMIMSSC monitoring features
- OMIMSSC Unit Monitors
- Event rules used by different monitoring features of OMIMSSC
- Additional resources
- Accessing support content from the Dell EMC support site
- Contacting Dell Technologies
- Glossary
- Additional topics

Table 22. State views displayed by different monitoring features of OMIMSSC
State View Type
displayed on the SCOM
console
OMIMSSC monitoring feature
Server and
Rack Workstation
(Licensed)
Chassis Network Switches
Network Switch State View No No Yes
Performance and power monitoring views displayed by different
monitoring features of OMIMSSC
The performance view allows you to customize how you want to view performance data collected from performance objects
and counters. This includes the ability to view historical and current operational data together. You must select Show in the
Details pane to display data from a rule in the graph in the Results pane.
Performance and power monitoring view in the licensed monitoring feature of
OMIMSSC for PowerEdge servers and workstations
The following OMIMSSC performance and power monitoring views are displayed for PowerEdge servers and workstations:
● Dell Performance View
● Disk Performance - iSM
NOTE:
By default, all performance metric rules are disabled for the Dell EMC Server and Rack Workstation Monitoring
(Licensed) feature.
As a part of the OMIMSSC performance and power monitoring view for servers and rack workstations, the following System
Board Usage views are displayed:
● CPU Usage (%)
● IO Usage (%)
● Memory Usage (%)
● Overall System Usage (%)
NOTE:
● System Board Usage metrics are supported only on some of the 13th generation of the PowerEdge servers. By default,
the Dell Server Performance rule is set to Disabled.
● The Dell EMC Performance View displays the performance index of CPU, Memory and I/O utilization index, and system
level CUPS index in a graphical format.
Performance and power monitoring view in the licensed monitoring feature of
OMIMSSC for chassis
The following OMIMSSC performance and power monitoring view is displayed for Dell EMC chassis:
● Dell EMC Chassis Performance View
NOTE:
Dell EMC Chassis Performance View is available only when the Detailed feature of the Dell EMC Chassis Monitoring
feature is installed, and you have selected Metrics Monitoring as Yes while overriding the metrics parameters.
OMIMSSC Unit Monitors
A unit monitor monitors the performance counter over two successive cycles to check if it exceeds a threshold value. When the
threshold value is exceeded, the Dell EMC PowerEdge Server changes state and generates an alert. This unit monitor is disabled
by default. You can override (enable) the threshold values in the Authoring pane of the SCOM console. Unit monitors are
available under Dell Windows Server objects for the Dell EMC Server and Rack Workstation Monitoring feature. To enable the
threshold values of unit monitors, see Enable performance and power monitoring unit monitors on page 42. Dell Unit monitors
Reference topics
93