
Users Guide
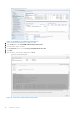
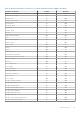
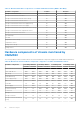
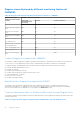
Table Of Contents
- Dell EMC OpenManage Integration Version 7.2 with Microsoft System Center for System Center Operations Manager User's Guide
- Contents
- About this guide
- About Dell EMC OpenManage Integration with Microsoft System Center (OMIMSSC) for System Center Operations Manager (SCOM)
- Purchase and manage OMIMSSC license
- Port information and Communication Matrix for OMIMSSC appliance
- Support Matrix
- Deploy and configure the OMIMSSC appliance
- OMIMSSC and SCOM interfaces for device management
- Enroll (register) management servers to OMIMSSC
- Tasks you can perform on the OMIMSSC Admin Portal
- Manage OMIMSSC from the SCOM console
- Discovery and monitoring of PowerEdge servers by using the licensed monitoring features of OMIMSSC
- Introduction to the licensed monitoring features in OMIMSSC for PowerEdge servers and rack workstations
- Discovery and classification of PowerEdge servers and workstations by using WS-Man or iDRAC access using Host operating system
- Prerequisites to discover PowerEdge Servers using Dell EMC Server and Rack Monitoring (Licensed)
- Discover PowerEdge servers by using iDRAC WS-Man through OMIMSSC
- Discover PowerEdge servers by using the SCOM console
- Object discoveries using WS-Man
- Install SNMP services to monitor PowerEdge servers
- Monitoring PowerEdge servers and rack workstations on the SCOM console
- Discovery and monitoring of Dell EMC chassis using OMIMSSC
- Discovery and monitoring of Dell EMC Network Switches using OMIMSSC
- Discovery and classification of network switches
- Override properties to customize the network switch discovery process
- Import network switch management packs for discovery from OMIMSSC Admin Portal
- Discover Dell EMC Network Switches by using OMIMSSC
- Discover Dell EMC Network Switches by using SCOM
- Network Switches monitoring feature in OMIMSSC
- Manage Dell EMC devices using the OMIMSSC appliance
- View jobs in OMIMSSC Admin Portal and OpenManage Integration Dashboard
- Run tasks on the SCOM console for OMIMSSC monitoring features
- Run OMIMSSC monitoring feature-based tasks on SCOM
- Tasks run on Dell EMC devices by using the OMIMSSC monitoring features
- Check connection to the nodes
- View warranty information of PowerEdge servers
- Start OMSA on monolithic servers using the SCOM console
- Start iDRAC using the SCOM console
- Start Remote Desktop on monolithic servers using the SCOM console
- Perform a remote iDRAC hard reset operation
- Clear Embedded Server Management (ESM) logs
- Power management-related tasks
- Start the Dell CMC console
- Upgrading the OMIMSSC appliance
- De-enroll (Deregister) management servers enrolled to OMIMSSC
- Remove an OMIMSSC VM
- Troubleshooting
- After deploying the OMIMSSC appliance, an IP address is not assigned to the OMIMSSC appliance
- After deploying the OMIMSSC appliance, enrollment of management servers with OMIMSSC is unsuccessful or the management packs are not successfully installed.
- Unable to start the OpenManage Integration Dashboard in the SCOM console
- Unable to connect to the OMIMSSC appliance
- Issues observed when usernames of local account and domain account match but the passwords differ
- Resolve issues in synchronizing data of Dell EMC devices with OMIMSSC
- Manually clean the SCOM console that is unreachable during the de-enrollment
- Connection is unavailable between OMIMSSC and the SCOM console
- Unable to log in to the OMIMSSC Admin portal by using the Mozilla Firefox browser
- A job run on OMIMSSC to discover a device stays in the Progress state for more than five hours
- Unable to discover and monitor devices after restarting OMIMSSC
- Event ID 33333: Data Access Layer rejected retry on SqlError
- Resolve issues in the Dell EMC Feature Management Dashboard
- Reference topics
- Monitoring features supported by OMIMSSC
- Configuring the monitoring features of OMIMSSC by using the Feature Management Dashboard
- Import monitoring features using the Dell EMC Feature Management Dashboard
- Upgrade monitoring features using the Dell EMC Feature Management Dashboard
- Customizing monitoring features using the Feature Management Dashboard for scalable and detailed editions
- Remove monitoring features using the Dell EMC Feature Management Dashboard
- Severity levels of discovered devices
- Key features of licensed monitoring of PowerEdge servers in OMIMSSC
- System configuration lockdown mode in iDRAC9 PowerEdge servers
- iDRAC Group Manager in iDRAC9 PowerEdge servers
- Event auto resolution
- Capacity planning of PowerEdge servers discovered through iDRAC and iSM
- Detect and restore the status of a failed CMC or OpenManage Enterprise-Modular
- Port connection information of PowerEdge servers discovered through iDRAC and iSM
- Hardware components of servers and rack workstations monitored by OMIMSSC
- Hardware components of chassis monitored by OMIMSSC
- Hardware components of network switches monitored by OMIMSSC
- View options provided by the OMIMSSC monitoring features
- OMIMSSC Unit Monitors
- Event rules used by different monitoring features of OMIMSSC
- Additional resources
- Accessing support content from the Dell EMC support site
- Contacting Dell Technologies
- Glossary
- Additional topics

and Disable Event Resolution, are available under Dell EMC > Dell EMC Feature Management Dashboard > Dell EMC
Server and Rack Workstation Monitoring (Licensed) > Dell EMC Monitoring Feature Tasks.
Capacity planning of PowerEdge servers discovered through iDRAC
and iSM
You can monitor if the server’s utilization has exceeded the configured capacity threshold value using the Dell Server Capacity
Check unit monitor. The unit monitor—Dell Server Capacity Check monitors the average system or CUPS usage for the last one
day of each server against the configured capacity threshold value. By default, this unit monitor is disabled. To enable the Dell
Server Capacity Check unit monitor, see Enable performance and power monitoring unit monitors on page 42.
The minimum threshold value is 1, and the maximum threshold value is 99. The default threshold value is 60. You can configure
the threshold values within the specified range. That is, 1–99. In case, you provide a threshold value other than the specified
ranges, that threshold is reset to its default value.
A warning event per server is generated when the average system or CUPS usage for the last one day exceeds the configured
threshold value. The warning event is auto resolved when the average system or CUPS usage for the last one day returns within
the configured threshold value.
You can view the details of the warning alert in the Alert Details pane under Monitoring.
Detect and restore the status of a failed CMC or OpenManage
Enterprise-Modular
Using the “iDRAC detection of a failed Dell EMC Chassis Management Controller/OpenManage Enterprise Modular (CMC/
OME- M)” feature, iDRAC of a Rack Style Management (RSM) enabled modular server detects a failed or an unavailable CMC.
By using this feature, you can take immediate remedial action to bring the failed Dell EMC CMC/OME-M to a normal state.
The Dell Chassis Controller Sensor indicates the presence or failure of a Dell EMC CMC/OME-M. You can view the health state
that is obtained from the unit monitor by clicking Dell EMC Diagram Views > Dell Chassis Controller Sensor under Sensors.
NOTE:
● The Dell Chassis Controller Sensor is available in both the Scalable and Detailed Management Pack editions.
● iDRAC detection of failed Dell EMC CMC/OME-M is supported for YX3X and iDRAC9-based PowerEdge FX2 Chassis.
Port connection information of PowerEdge servers discovered
through iDRAC and iSM
NOTE: This feature is supported for iDRAC9-based PowerEdge servers only.
Server port connection information feature provides information about the physical mapping of switch ports to server ports,
and iDRAC dedicated port connections. This feature enables you to reduce cabling error debugging by identifying switch ports
that are connected to a server’s network ports, and iDRAC dedicated port. You can view the information about the Server port
connection under iDRAC NIC and NIC objects in the Detail View pane of the Dell EMC Diagram View. Along with the inventory
information of each NIC, chassis ID information of the switch and the port ID information is populated. This feature is available
for Dell EMC PowerEdge servers that are discovered through both the iDRAC and iSM methods of Dell EMC Server and Rack
Workstation Monitoring (Licensed) feature.
Hardware components of servers and rack
workstations monitored by OMIMSSC
The following table provides information about the monitored hardware components that are supported in Scalable and Detailed
feature for Dell EMC devices that are discovered through iDRAC–WS-Man in OMIMSSC.
Table 17. Monitored hardware components—Scalable and Detailed feature (iDRAC–WS-Man)
86 Reference topics