
Users Guide

Dell EMC Monolithic Servers Diagram View
The Dell EMC Monolithic Servers Diagram View offers a graphical representation of all Monolithic systems and allows you to expand
and verify the status of individual devices and their components in the diagram.
Dell EMC Sled Servers Diagram View
The Dell EMC Sled Servers Diagram View offers a graphical representation of all Sled servers and allows you to expand and verify the
status of individual devices and their components in the diagram. Select a Sled server in the diagram to view its details in the Detail View
pane.
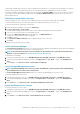
Dell EMC PowerEdge Server Unit Diagram view by Dell EMC Server and Rack workstation
(Licensed) feature on the Operations Manager console
Select a Dell EMC PowerEdge server, from the Dell EMC Modular System or Dell EMC Monolithic Server diagram views, to view the
diagram specific to that particular system.
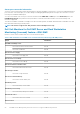
System-specific diagrams illustrate and indicate the status of the following components:
• Network Interfaces Group
• Memory Group
• Power Supply Group
• Sensors Group
• Processor Group
• Storage Components Group
• Host NIC Group
• iDRAC License Group
• PCIe/ SSD Group
• SD Card Group
• BIOS (inventory only)
• iDRAC
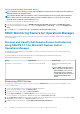
Dell EMC Performance and Power Monitoring Views through iSM–WMI
NOTE:
• System Board Usage metrics are supported only on some of the 13th generation of the PowerEdge servers. For more
information on performance information collection, see View Dell EMC servers performance collection rules set on
Operations Manager. By default, the Dell Server Performance rule is set to Disabled.
• The Dell EMC Performance View displays the performance index of CPU, Memory and I/O utilization index, and
system level CUPS index in a graphical format.
To view the performance and power monitoring on the Operations Manager console:
1. Launch the Operations Manager console and click Monitoring.
2. In the Monitoring pane, click Dell EMC > Dell EMC Performance and Power Monitoring for the following views:
• Dell Performance View (iSM)
• Disk Performance - iSM (%)
NOTE:
All performance metric rules are disabled by default for Dell EMC Server and Rack Workstation Monitoring
(Licensed) feature.
3. To view the System Board Usage metrics, click Dell EMC Performance and Power Monitoring > Dell EMC System Board
Usage for the following views:
• CPU Usage - iSM (%)
• IO Usage - iSM (%)
• Memory Usage - iSM (%)
• Overall System Usage - iSM (%)
4. Select the counters from the individual performance views and select the time range for which the values are required.
The data collected is represented in a graphical format for each system.
A unit monitor, monitors the performance counter over two successive cycles to check if it exceeds the configured critical threshold
value. When the critical threshold value is exceeded, the server changes state and generates a critical alert. This unit monitor is disabled by
default. You can override (enable) the threshold values from the Authoring pane of the Operations Manager console. Unit monitors are
Dell EMC Server Management pack suite version 7.1.1 supported Monitoring features
51