
Users Guide
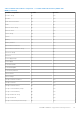
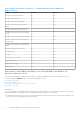
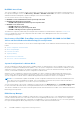
Table Of Contents
- Dell EMC OpenManage Integration Version 7.1.1 for Microsoft System Center for Operations Manager (SCOM) User's Guide
- Introduction to Dell EMC OpenManage Intergration and Dell EMC Server Management Pack suite version 7.1.1 for Microsoft System Center Operations Manager
- Dell EMC OMIMSSC
- Dell EMC Feature Management Dashboard
- Dell EMC Server Management pack suite version 7.1.1 supported Monitoring features
- Dell EMC Servers and Rack Workstation monitoring feature
- Compare Scalable and Detailed Editions of Dell EMC Servers and Rack Workstation Monitoring
- Discover and classify Dell EMC PowerEdge Servers by using DSMPS version 7.1.1 for Operations Manager
- Monitoring Dell EMC PowerEdge Servers in Operations Manager
- Monitored hardware components
- Dell EMC Server Management Pack 7.1.1—View options for Dell EMC Server and Rack workstation on the Operations Manager console
- Dell EMC Alerts Views
- Viewing Alerts for Dell EMC Server and Rack Monitoring feature on the Operations Manager Console
- Diagram views of Dell EMC PowerEdge Servers for Dell EMC Server and Rack Monitoring feature on the Operations Manager console
- Dell EMC Complete Diagram View
- Dell EMC Rack Workstation Diagram Views
- Dell EMC Modular and Dell EMC Monolithic Systems
- Dell EMC Modular Systems Diagram View
- Dell EMC Monolithic Servers Diagram View
- Dell EMC Sled Servers Diagram View
- Dell EMC PowerEdge Server unit diagram view by Dell EMC Server and Rack Workstation Monitoring feature on the Operations Manager console
- Storage Controller Component Hierarchy
- Dell EMC Network Interfaces Component Hierarchy
- Enabling Correlation
- Enabling Network Interfaces Group to Dell Server Health Roll Up
- Dell EMC Performance and Power Monitoring Views
- Enabling Performance and Power Monitoring Unit Monitors
- Dell EMC State Views
- Dell Unit monitors for Dell EMC Servers and Rack workstation feature
- Rules
- Dell EMC PowerEdge Server Tasks
- Summary of managed Tasks
- Performing tasks using Dell EMC Server and Rack Workstation Monitoring Feature
- Tasks performed on Dell Windows server by using Operations Manager console
- Check Node Interfaces
- Check power status
- Clear ESM logs
- Force Power Off
- Get Warranty Information
- Launch Dell License Manager on X64 Bit Management Server
- Launch Dell OpenManage Power Center
- Launch Dell Remote Access Console
- Launch OpenManage Server Administrator
- Launch Remote Desktop
- Power cycle
- Power Off Gracefully
- Power On
- Power Reset
- Enable LED identification on Dell EMC PowerEdge Servers on Operations Manager console
- Disable LED identification on Dell EMC PowerEdge Server by using Operations Manager console
- Reports about Dell EMC PowerEdge Server on the Operations Manager
- View reports about Dell EMC PowerEdge Server on the Operations Manager
- Generate OpenManage Windows Event Log report on the Operations Manager
- Generate BIOS configuration report on the Operations Manager
- Generate firmware and driver report on the Operations Manager
- Generate RAID configuration report on the Operations Manager
- Dell EMC Server and Rack Workstation Monitoring (Licensed) Feature
- iSM–WMI using Dell EMC Server Management Pack suite version 7.1.1 Operations Manager
- Compare Scalable and Detailed Edition Features—iSM-WMI
- Discover and classify Dell EMC PowerEdge Servers by using DSMPS version 7.1.1 through iSM–WMI
- Monitoring
- Monitored Hardware components
- View options for Dell EMC PowerEdge Servers through iSM–WMI on the Operations Manager console
- Dell EMC Alerts Views
- Viewing Alerts for Dell EMC Server and Rack Workstation (Licensed) feature on the Operations Manager Console–through iSM–WMI
- Diagram views of Dell EMC PowerEdge Servers for Dell EMC Servers and Rack Workstation (Licensed) feature on the Operations Manager console
- Viewing Dell EMC Diagram Views for Dell EMC Server and Rack Workstation (Licensed) feature on the Operations Manager console—iSM–WMI
- Dell EMC Complete Diagram View
- Dell EMC Rack Workstation Diagram View
- Dell EMC Modular and Dell EMC Monolithic Systems
- Dell EMC Modular Systems Diagram View
- Dell EMC Monolithic Servers Diagram View
- Dell EMC Sled Servers Diagram View
- Dell EMC PowerEdge Server Unit Diagram view by Dell EMC Server and Rack workstation (Licensed) feature on the Operations Manager console
- Dell EMC Performance and Power Monitoring Views through iSM–WMI
- Enabling Performance and Power Monitoring Unit Monitors
- Dell EMC State Views
- Key features of Dell EMC Server and Rack Workstation Monitoring (Licensed) Feature
- System Configuration Lockdown Mode
- iDRAC Group Manager
- Capacity planning
- iDRAC detection of failed CMC/OME-M
- Server port connection information
- Dell Unit Monitors for Dell EMC Server and Rack Workstation Monitoring (Licensed) feature—iSM–WMI
- Rules
- Dell EMC PowerEdge Server Tasks
- Summary of managed Tasks
- Performing tasks using Dell EMC Server and Rack Workstation Monitoring (Licensed) feature—iSM–WMI
- Check Node Interfaces
- Get Warranty Information
- Remote iDRAC hard reset
- Performing a remote iDRAC hard reset
- Launch Dell License Manager
- Launch Dell OpenManage Power Center
- Launch Dell Remote Access Console
- Launch Remote Desktop (Monolithic Server)
- iSM–WMI using Dell EMC Server Management Pack suite version 7.1.1 Operations Manager
- DRAC Monitoring Feature for Operations Manager
- Discover and classify Dell Remote Access Controllers by using DSMPS 7.1.1 for Microsoft System Center Operations Manager
- Monitoring DRAC devices in Operations Manager
- Dell EMC Server Management Pack 7.1.1-View options for DRAC Monitoring feature on the Operations Manager console
- Dell EMC Alerts Views
- Viewing Alerts for DRAC Monitoring feature on the Operations Manager Console
- Diagram Views of Remote access controllers for DRAC monitoring feature on the Operations Manager console
- Dell EMC State Views
- Dell Unit Monitors for DRAC Monitoring Feature
- Rules
- Dell EMC PowerEdge Server Tasks
- Dell EMC Servers and Rack Workstation monitoring feature
- Dell EMC OMIMSSC supported monitoring features
- Dell EMC Server and Rack Workstation Monitoring (Licensed) Feature
- iDRAC–WS-MAN or iDRAC access via Host OS using OMIMSSC
- Compare Scalable and Detailed Editions of Dell EMC Server and Rack Workstation Monitoring (Licensed)
- Discover and classify Dell EMC PowerEdge Servers through iDRAC–WS-MAN
- Monitoring
- Monitored hardware components
- View options for Dell EMC PowerEdge Servers through iDRAC–WS-MAN on the Operations Manager console
- Viewing Alerts for Dell EMC Server and Rack Monitoring (Licensed) feature on the Operations Manager Console
- Diagram views of Dell EMC PowerEdge Server for Dell EMC Server and Rack Monitoring (Licensed) feature on Operations Manager console
- Viewing Dell EMC Diagram Views for Dell EMC Server and Rack Workstation (Licensed) feature on the Operations Manager console
- Dell EMC Rack Workstation Diagram Views
- Dell EMC Modular and Dell EMC Monolithic Systems
- Dell EMC Modular Systems Diagram View
- Dell EMC Monolithic Servers Diagram View
- Dell EMC Sled Servers Diagram View
- Dell EMC PowerEdge Server Unit diagram view by Dell EMC Server and Rack workstation (Licensed) feature on the Operations Manager console
- Storage Controller Component Hierarchy
- Dell EMC Performance and Power Monitoring Views through iDRAC–WS-MAN
- Enabling Performance and Power Monitoring Unit Monitors
- Dell EMC State Views
- Key features of Dell EMC PowerEdge Server through iDRAC–WS-MAN for Dell EMC Server and Rack Workstation Monitoring (Licensed) feature
- System Configuration Lockdown Mode
- iDRAC Group Manager
- Event Auto Resolution
- Capacity planning
- Enabling Dell Server Capacity Check unit monitor
- iDRAC detection of failed Dell EMC Chassis Management Controller/OpenManage Enterprise Modular (CMC/OME-M)
- Server port connection information
- Unit monitors for Dell EMC Servers and Rack workstations (Licensed) feature—iDRAC–WS-MAN
- Rules
- Dell EMC PowerEdge Server Tasks
- iDRAC–WS-MAN or iDRAC access via Host OS using OMIMSSC
- Dell EMC Chassis Monitoring feature
- Discover and classify Dell EMC Chassis using Dell EMC OMIMSSC Operations Manager
- Monitoring
- Dell Unit Monitors for Dell EMC Chassis Monitoring feature
- Rules
- Dell EMC PowerEdge Server Tasks
- Dell EMC Chassis Modular Server Correlation Feature
- Dell EMC Network Switch Monitoring feature
- Importing Dell EMC Network Switch Management packs for discovery from the OMIMSSC Admin portal
- Discover and classify Dell EMC Network Switch using Dell EMC OMIMSSC Operations Manager
- Monitoring
- View options for Dell EMC Network Switch on the Operations Manager console
- Dell Unit Monitors for Dell EMC Network Switch Monitoring feature
- Dell EMC Server and Rack Workstation Monitoring (Licensed) Feature
- Appendix A—Issues and resolutions
- Appendix B
- Create a simple authentication run-as account
- Associating a Run As Account for monitoring a Dell EMC PowerEdge Server using the Dell EMC Server and Rack Workstation Monitoring (Licensed) feature
- Severity levels used in Dell EMC Server Management Pack suite and OMIMSSC Operations Manager
- Associate Run As Account task—Dell EMC Server and Rack Workstation Monitoring (Licensed) feature
- Appendix C - Enabling External Program Tasks
- Accessing documents from the Dell EMC support site
- Related documentation and resources

1. Log on to Operations Manager as an administrator for the Operations Manager Management Group.
2. On the Operations Manager console, click Authoring.
3. At the bottom of the navigation pane, click Add Monitoring Wizard.
The Add Monitoring Wizard screen is displayed.
4. On the Select Monitoring Type screen, select WS-Management and SMASH Device Discovery and click Next.
5. On the General Properties screen, in the Name field provide a name for the wizard.
6. Under Management pack, click New.
The Create a Management Pack screen is displayed.
7. Provide a name for the management pack in the Name field and click Next.
For information on creating a management pack, see the Operations Manager documentation at
technet.microsoft.com.
8. Click Create.
The management pack you created is selected in the Management pack drop-down box.
9. Click Next.
10. On the Specify the target drop-down menu, select a resource pool for monitoring these devices and click Next.
11. On the Specify the account to be used to run discovery screen, click New and create a Simple Authentication Run As
Account.
For more information on creating a Simple Authentication type Run As Account, see Creating a Simple Authentication Run As
Account.
NOTE: If you are using AD domain credentials for iDRAC, then, enter the credentials in the following format:
username@domainname.com.
12. Select the Run As Account you created from the Run As Account drop-down menu and click Next.
13. Click Add.
14. On the Add Devices screen specify the iDRAC IP (if your preferred discovery method is iDRAC–WS-MAN) or the Host
IP (if your preferred discovery method is iDRAC access via Host OS) address of the systems you want to discover, based
on your monitoring preference. You can specify the preferred IP address of the systems by:
● Scanning the IP Subnet that you provided.
● Scanning a specified IP Range.
● Importing a text file containing the list of iDRAC IP/ Host IP addresses.
For more information, see Configuration by using iSM PowerShell script in the Integrated Dell Remote Access
Controller7/9 with Lifecycle Controller User’s Guide at Dell.com/idracmanuals.
15. Click Advanced Options, select the Skip CA Check and Skip CN Check option and click OK.
16. Click Scan for Devices to search Dell EMC PowerEdge Servers on your network.
The IP addresses are listed under Available Devices.
17. Click Add to add the list of IP addresses you want to monitor and click OK.
18. On the Specify the devices you want to monitor screen, click Create.
19. Click Close.
The scanned Dell EMC PowerEdge Servers initially appear in Monitoring > WS-Management and SMASH Monitoring
> WS-Management Device State screen. After the automatically triggered SMASH discovery is completed by the
Operations Manager, the Dell EMC PowerEdge Servers appear in Monitoring > WS-Management and SMASH
Monitoring > SMASH Device State screen.
20. Enable the Dell EMC Server and Rack Monitoring (Licensed) feature through Dell EMC Feature Management Dashboard.
Object discoveries through iDRAC–WS-MAN on the Operations Manager
Table 25. Objects discovered through iDRAC–WS-MAN
Discovery Object Description
Dell EMC PowerEdge Server Discovery Classifies the Dell EMC PowerEdge Servers and populates the
key attributes and components.
Dell Device Helper Discovery Discovers the DellDeviceHelper as an object.
Dell Host NIC Correlation Discovery
Correlates the Host NIC interfaces with Physical interfaces.
Dell EMC OMIMSSC supported monitoring features 73