
Users Guide


Views
Dell EMC Server Management Pack Suite provides the following types of views for monitoring, under Dell > Monitoring on the OpsMgr
console:
• Alerts Views
• Diagram Views
• State Views
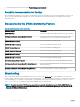
Alerts Views
This view is available for managing hardware and storage events from Dell DRAC devices. SNMP traps and Platform Event Traps (PET)
sent by DRAC devices are displayed by the DRAC monitoring feature.
Viewing Alerts on the OpsMgr Console
To view DRAC alerts on the OpsMgr console:
1 Launch the OpsMgr console and click Monitoring.
2 Click Dell > Alerts Views.
The following Alerts Views are displayed.
• PET Traps — These alerts contain information on PET traps from iDRAC6, iDRAC7, and iDRAC8 devices.
• Remote Access Alerts — These alerts contains information on SNMP traps from iDRAC6, iDRAC7 and iDRAC8 devices.
3 Select an alert to view the details in the Alert Details pane.
On the right pane of each of the individual Alerts Views, alerts that meet the criteria you specify, such as alert severity, resolution
state, or alerts that are assigned to you is displayed.
Diagram Views
The Diagram Views oers a hierarchical and graphical representation of all Dell DRAC devices on the network.
Viewing Diagrams on the OpsMgr console
To view the diagrams for DRAC monitoring feature on the OpsMgr console:
1 Launch the OpsMgr console and click Monitoring > Dell > Diagram Views.
2 In the Monitoring pane on the left side, navigate to the Diagram Views folder for the following views:
• Complete Diagram View
• Remote Access Controllers Group
3 Select any of the Diagram Views.
On the right pane the hierarchical and graphical representation of the selected Dell device is displayed.
4 Select a component in the diagram to view its details in the Detail View pane.
DRAC Monitoring Feature
75