
Users Guide
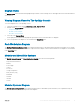
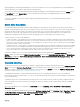

Monolithic Servers Diagram
The Monolithic Systems Diagram View oers a graphical representation of all Monolithic systems and allows you to expand and verify the
status of individual devices and their components in the diagram.
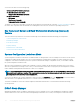
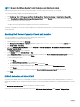
Sled Servers Diagram
The Sled Servers Diagram view oers a graphical representation of all Sled servers and allows you to expand and verify the status of
individual devices and their components in the diagram. Select a Sled server in the diagram to view its details in the Detail View pane.
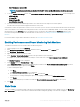
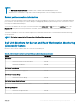
Dell Server Instance Diagram
Select a Dell server, from the Modular System or Monolithic Server diagram views, to view the diagram specic to that particular system.
System-specic diagrams illustrate and indicate the status of the following components:
• Physical interfaces
• Memory
• Power supply
• Sensors
• Processors
• Storage components
• Host NIC
• License
• PCIe/ SSD
• SD Card
• BIOS (inventory only)
• iDRAC NIC
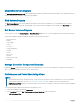
Storage Controller Component Hierarchy
Expand the Storage component in any Dell system instance diagram view, to view the status and health of components such as physical
disks, connectors, virtual disks, controllers, sensors, and enclosures.
Performance and Power Monitoring Views
NOTE
:
• System Board Usage metrics are supported only on some of the 13th generation of the PowerEdge servers. For more information
on performance information collection, see Performance Collection Rules. Also, enable the Dell Server Performance rule.
• Dell Performance View displays the performance index of CPU, memory, I/O utilization, and system level CUPS index in a graphical
format.
To view the performance and power monitoring on the OpsMgr console:
1 Launch the OpsMgr console and click Monitoring.
2 In the Monitoring pane, click Dell > Performance and Power Monitoring for the following views:
• Dell Performance View
42
Server and Rack Workstation Monitoring (Licensed) Feature