Dell EMC Server Management Pack Suite Version 7.
Notes, cautions, and warnings NOTE: A NOTE indicates important information that helps you make better use of your product. CAUTION: A CAUTION indicates either potential damage to hardware or loss of data and tells you how to avoid the problem. WARNING: A WARNING indicates a potential for property damage, personal injury, or death. Copyright © 2009 - 2017 Dell Inc. or its subsidiaries. All rights reserved. Dell, EMC, and other trademarks are trademarks of Dell Inc. or its subsidiaries.
Contents 1 Introduction....................................................................................................................................................6 Terms used in this document............................................................................................................................................6 What is new in this release...............................................................................................................................................
Tasks............................................................................................................................................................................69 5 DRAC Monitoring Feature............................................................................................................................ 73 Discovery and grouping...................................................................................................................................................
Discovery by Dell Feature Management Pack..............................................................................................................90 Tasks..................................................................................................................................................................................90 Feature Management Tasks.....................................................................................................................................
1 Introduction This document describes the activities that you can perform with the Dell EMC Server Management Pack Suite version 7.0 for Microsoft System Center Operations Manager.
Term Refers to Integrated Dell Remote Access Controllers (iDRAC) iDRAC of Dell servers, Dell branded OEM servers, and Dell OEM Ready servers, unless otherwise specified. Chassis Chassis Management Controller (CMC), unless otherwise specified. Servers PowerEdge servers, PowerVault monolithic and modular servers, supported Rack Workstations, Dell branded OEM servers, and Dell OEM Ready servers, unless otherwise specified.
Key features of Dell EMC Server Management Pack Suite This version of Dell EMC Server Management Pack Suite provides the following features for managing the Dell devices: Table 2.
2 Overview of Dell EMC Server Management Pack Suite The Dell EMC Server Management Pack Suite for OpsMgr enables you to: • Discover and classify the following Dell devices: • Dell Servers—Using license-free monitoring, and license-based monitoring • Dell Remote Access Controllers • Dell Chassis—PowerEdge FX2/ FX2s, PowerEdge VRTX, PowerEdge M1000e, and Dell OEM Ready Chassis • Supported Dell Precision Racks • Monitor the discovered Dell devices through OMSA, iDRAC, or iSM based on your requirement
3 Server and Rack Workstation Monitoring feature Server and Rack Workstation Monitoring feature supports the discovery and monitoring of the following devices that are installed with the supported Windows OS, using the OpenManage Server Administrator (OMSA): • PowerEdge Modular and Monolithic servers • PowerVault storage servers • Dell OEM Ready servers • Dell Precision Racks Inventory and monitoring of these devices could be done through the server's OpenManage Server Administrator (OMSA) which is
Discovery and grouping The Dell EMC Server Management Pack Suite enables you to discover and classify Dell Servers—Monolithic, Modular, Sleds, and supported Dell Precision Racks. The following table lists the details of the hardware discovery and grouping: Table 4. Dell hardware discovery and grouping Group Diagram View Hardware Type Dell Servers Dell Monolithic Servers PowerEdge systems. Dell Modular Servers PowerVault storage servers.
discovery Description Dell Server Hardware Components discovery Discovers hardware components at a group level (such as sensors, processor, memory, and power supply). Dell OpenManage Software Services discovery Discovers the objects for OpenManage Server Administrator Windows services. Dell Server Detailed BIOS discovery Discovers BIOS objects for each Dell server (Detailed edition only). Dell Server Detailed Memory discovery Discovers memory instances for the Dell server (Detailed edition only).
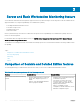
Monitored hardware components The following table provides information about the monitored hardware components supported in the Scalable and Detailed feature: Table 6.
Hardware components Scalable Detailed Power Supplies Unit Instance No Yes Storage Controller Physical Disk Instance No Yes Storage Connector Physical Disk Group No Yes Storage Controller Connector Instance No Yes Storage Controller Enclosure Instance No Yes Storage Controller Sensors No Yes Storage Controller Virtual Disk Group No Yes Storage Enclosure EMM Instance No Yes Storage Enclosure Physical Disk Group No Yes Storage Enclosure Power Supply Group No Yes Storage Enclosu
Viewing Alerts on OpsMgr Console To view alerts on the OpsMgr console: 1 Launch the OpsMgr console and click Monitoring > Dell > Alerts Views. The following alerts are displayed: • Network Interface Alerts—Link-up and Link-down alerts from the discovered NICs are displayed. • Server and Rack Workstation Alerts—OMSA alerts from the Dell servers and Rack Workstations are displayed.
Rack Workstation Diagram The Dell Rack Workstation Diagram Views offers a graphical representation of all supported Rack Workstations and allows you to expand and verify the status of individual devices and their components in the diagram. Select a Rack Workstation in the diagram to view its details in the Detail View pane.
Figure 1. Dell Server Instance Diagram System-specific diagrams illustrate and indicate the status of the following components: • Physical and teamed network interfaces • Memory • Power supply • Sensors • Processors • Dell OpenManage software services • Storage components • BIOS (inventory only) The memory, processors, network, sensors, storage, and power supply components are displayed in detail by the Detailed edition of the Server and Rack Workstation Monitoring feature.
The Override Properties page is displayed. 6 Select Enable Correlation and set the Override Value to True and click OK. The status roll-up of network interfaces on the diagram view is displayed only up to the Network Interfaces group level.
Performance and Power Monitoring Views To view the performance and power monitoring on the OpsMgr console: 1 Launch the OpsMgr console and click Monitoring.
a Click New... b The Create a Management Pack screen is displayed. Provide a name for the management pack in the Name field and click Next. c For information on creating a management pack, see the OpsMgr documentation at technet.microsoft.com. Click Create. The management pack you created is selected in the Select destination management pack: drop-down menu. 8 Click Apply. State Views This view is available for viewing the health of all Dell servers and Rack Workstations.
Object Unit Monitor OpenManage Software Services Dell Server Management (DSM) Connection Service Availability Status Periodic DSM Data Manager Availability Status Periodic DSM Event Manager Availability Status Periodic DSM Shared Service Availability Status Periodic DSM Storage Service Availability Status Periodic Windows Management Instrumentation (WMI) Service Availability Status Periodic Power Supplies Dell Server Power Supplies Status Event and Periodic Dell Server Processors Status Eve
Object Unit Monitor Dell Server iDRAC Network Interface Monitor Periodic Dell OM Performance Ambient Temperature Average Threshold AlertMonitor Periodic Amperage Average Threshold AlertMonitor Periodic EnergyConsumption Average Threshold AlertMonitor Periodic PowerConsumption (BTU/hr) Average Threshold Periodic PowerConsumption (Watts) Average Threshold AlertMonitor Periodic Dell OM Server Unsupported Unit Monitor Periodic Dell Unit Monitors — Detailed Edition Table 8.
Object Unit Monitor Controller Enclosure Event Monitor Event and Periodic Controller Enclosure Unit Monitor Event and Periodic Storage Controller Physical Disk Instance Controller Physical Disk Event Monitor Event and Periodic Controller Physical Disk Unit Monitor Event and Periodic Enclosure Physical Disk Event Monitor Event and Periodic Enclosure Physical Disk Unit Monitor Event and Periodic Storage Controller Power Supply Instance Enclosure Power Supply Event Monitor Event and Periodic Enc
Object Unit Monitor Administrative Status Event and Periodic Connection Status Event and Periodic Link Status Event and Periodic Operational Status Event and Periodic Teamed Network Interface Instance (Basic) Teamed Network Interface (Basic) Availability Status Event and Periodic Teamed Network Interface Instance (Enriched) Teamed Network Interface Instance (Enriched) Administrative Status Event and Periodic Teamed Network Interface Instance (Enriched) Connection Status Event and Periodic Tea
Dell Systems Event Processing Rules The Dell EMC Server Management Pack Suite processes rules from OMSA and OMSA Storage Management events. Server Administrator All informational, warning, and critical events for OMSA have corresponding event processing rule.
NOTE: Network Statistics are defined in Detailed edition of the Server and Rack Workstation Monitoring feature only and are disabled by default. To enable the feature, see Enabling Performance Collection Rules. Enabling Performance Collection Rules To enable this feature: 1 Launch OpsMgr console and click Authoring. 2 Click Rules and search for Enriched in the Look for: field. 3 Right-click the rule you want to enable.
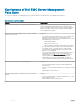
Task Description Clear ESM Logs Backs up the content of the Embedded System Management (ESM) log and clears the ESM log file for a selected system. Force Power Off Turns off the system power without shutting down the operating system. Get Warranty Information Retrieves the warranty information for the selected system. NOTE: An active internet connection is required to retrieve the warranty information.
Check Power Status You can check the power status and allow power control tasks through the IPMI shell. NOTE: To enable Advanced Power Control, install Baseboard Management Controller Management Utility (BMU) in the default path. If BMU is not installed in the default path, create a new console task. For more information on creating a new console task, see Creating Advanced Power Control And LED Identification Tasks.
To get warranty information: 1 In the OpsMgr console, navigate to a Dell Diagram Views, State Views, or Alerts Views. 2 Select the desired Dell server in any of the Diagram Views or State Views or an alert in the Alerts Views. 3 In the Tasks pane, select Dell Windows Server Tasks > Get Warranty Information.
Launch Remote Desktop To launch remote desktop: 1 In the OpsMgr console, navigate to a Dell Diagram Views, State Views, or Alerts Views. 2 Select the desired Dell server in any of the Diagram Views or State Views or an alert in the Alerts Views. 3 In the Tasks pane, select Dell Windows Server Tasks > Launch Remote Desktop. NOTE: Launching remote desktop is possible only if the remote desktop is enabled manually in the managed node.
Power Reset The Power Reset task allows you to power off and then power on the Dell server. NOTE: To enable Advanced Power Control, install BMU in the default path. If BMU is not installed in the default path, create a new console task. For more information on creating a new console task, see Creating Advanced Power Control And LED Identification Tasks. To reset the power of the system: 1 In the OpsMgr console, navigate to a Dell Diagram Views, State Views, or Alerts Views.
Accessing Reports To access reports: 1 Click Reporting on the OpsMgr console. 2 Click Dell Windows Server (Scalable Edition) for the OpenManage Windows Event Log and click Dell Windows Server (Detail Edition) for BIOS Configuration, Firmware and Driver Versions, and RAID Configuration reports. NOTE: You can also access Reporting from the Diagram View or State View by clicking on the server instance.
3 Click Firmware and Driver Versions, then click Open on the Task pane. 4 Select a time period for which you want the report generated. 5 Click Add Object. 6 Search for objects of class Dell Windows Server and click Add. You will find the object in the Selected object pane. 7 Click Run. The Firmware and Driver Versions report is generated. Generating RAID Configuration Report To create a report for RAID configuration: 1 On the OpsMgr console, click Reporting.
4 Server and Rack Workstation Monitoring (Licensed) Feature Server and Rack Workstation Monitoring (Licensed) feature provides detailed or scalable inventory, based on your method of discovery, and monitoring of the following devices: • 12th, 13th, and 14th generation of PowerEdge servers • PowerVault systems • Dell Precision Racks • Dell branded OEM servers • Dell OEM Ready servers Inventory and monitoring of these devices could be done through iDRAC or iDRAC Service Module (iSM) installed on the
• Dell OEM Ready servers NOTE: PowerVault systems are not supported for iDRAC Service Module (iSM). For more information about discovering Dell devices, see Discovering a Dell Server For more information about using the iDRAC access via Host OS (Experimental Feature), see the Integrated Dell Remote Access Controller7/8/9 with Lifecycle Controller User’s Guide at Dell.com/idracmanuals.
• For iDRAC access via Host OS: • Required iSM version is installed on the managed node. • iDRAC access via Host OS is enabled. This is an experimental feature. For more information, see the iDRAC access via Host OS (Experimental Feature) section in the Integrated Dell Remote Access Controller7/8 with Lifecycle Controller User’s Guide at Dell.com/idracmanuals.
Object discoveries by iDRAC using WS-MAN Table 12. Objects discovered through iDRAC using WS-MAN Discovery Object Description Dell Server Discovery Classifies the Dell servers and populates the key attributes and components. Dell Device Helper Discovery Discovers the DellDeviceHelper as an object. Dell Host NIC Correlation Discovery Correlates the Host NIC interfaces with Physical interfaces. NOTE: Teamed network interfaces will show only one of the NICs in the team.
Monitored hardware components The following table provides information about the monitored hardware components supported in Scalable and Detailed feature for devices discovered through iDRAC using WS-MAN. Table 13.
Hardware components Scalable Detailed Power Supply No Yes PCIeSSD Extender No Yes PCIeSSD Backplane No Yes PCIeSSD Physical Disk No Yes Server Sensors No Yes Server Storage Yes Yes Storage Controller Connector No Yes Storage Controller No Yes Storage Controller Sensor No Yes Storage Controller Battery Group No Yes Storage Controller Battery No Yes Storage Virtual Disk Group No Yes Storage Virtual Disk No Yes Storage Controller Physical Disk Group No Yes Storage C
Hardware components Scalable Detailed Temperature Sensor Group No Yes Temperature Sensor No Yes Voltage Sensor Group No Yes Voltage Sensor No Yes Views Dell EMC Server Management Pack Suite provides the following types of views for monitoring, under the Dell folder on the OpsMgr console: • Alerts Views • Diagram Views • Performance and Power Monitoring Views • State Views Alerts Views This view is available for managing hardware and storage events from Dell Servers and Rack Workstatio
Diagram Views The Diagram Views offers a hierarchical and graphical representation of all PowerEdge servers and supported Precision Rack Workstations on the network. Viewing Diagram Views On The OpsMgr Console To view the diagram views on the OpsMgr console: 1 Launch the OpsMgr console and click Monitoring > Dell > Diagram Views.
Monolithic Servers Diagram The Monolithic Systems Diagram View offers a graphical representation of all Monolithic systems and allows you to expand and verify the status of individual devices and their components in the diagram. Sled Servers Diagram The Sled Servers Diagram view offers a graphical representation of all Sled servers and allows you to expand and verify the status of individual devices and their components in the diagram.
• Disk Performance - Licensed (%) NOTE: All performance metric rules are disabled by default for Server and Rack Workstation Monitoring (Licensed) feature. 3 4 To view the System Board Usage metrics, click Performance and Power Monitoring > System Board Usage for the following views: • CPU Usage (%) • IO Usage (%) • Memory Usage (%) • Overall System Usage (%) Select the counters from the individual performance views and select the time range for the values required.
You can view the status for the following groups: • Servers and Rack Workstations (Licensed) • Dell Rack Workstation State Views • • Managed Rack Workstation (Licensed) Dell Server State Views • FM Servers • Sled Servers (Licensed) • Unmanaged Servers (Licensed) The health of a component is derived by reviewing the unresolved alerts associated with the component.
separate application. Using iDRAC Group Manager, you can view the details of a set of servers by permitting more powerful management than by inspecting servers visually for faults and other manual methods. You can view the details of the iDRAC Group Manager; iDRAC Group Manager Status, and iDRAC Group Name under the iDRAC object in the Detail View pane of the Diagram View. For more information about this feature, see Integrated Dell Remote Access Controller 9 Version 3.00.00.00 User's Guide.
NOTE: By default, the Dell Server Capacity Threshold Check column under State Views is disabled. Capacity Planning feature also provides a performance graph to show the trend for the Average SYS Usage/Day. To view the performance graph for the capacity planning feature: 1 Click Monitoring > Dell > Performance and Power Monitoring Views > System Board Usage > Overall System Usage (%).
NOTE: • The Dell Chassis Controller Sensor is available in both; Scalable and Detailed Management Pack. • iDRAC detection of failed CMC is supported for 13th and 14th generation of the PowerEdge FX2 Chassis. Server port connection information Server port connection information feature provides details of the physical mapping of switch ports to server ports, and iDRAC dedicated port connections.
Object Unit Monitor Dell Server Controller Battery Dell Server Controller Battery Unit Periodic Dell Battery Sensor Dell Server Battery Sensor Health Periodic Dell Battery Sensor Group Dell Server Battery Group Sensor Health Periodic Dell Current Sensor Dell Server Current Sensor Health Periodic Dell Fan Sensor Dell Server Fan Sensor Health Periodic Dell Fan Sensor Group Dell Server Fan Group Sensor Health Periodic Dell Intrusion Sensor Dell Server Intrusion Sensor Health Periodic Dell Modul
Object Unit Monitor Dell Network Interfaces Group Dell Server Network Interface Group Periodic Dell iDRAC Network Interface Dell Server iDRAC Network Interface Unit Periodic Dell Server Capacity Threshold Check Dell Server Capacity Threshold Check Periodic Dell Server Host NIC Dell Server Host NIC Periodic Dell Server License Dell Server License Periodic Dell Server License Group Dell Server License Group Periodic Physical Network Interface Dell Server Network Interface Unit Periodic PCIe SS
Object Unit Monitor Dell Storage Controller Enclosure EMM Dell Server Enclosure EMM Periodic Dell Storage Controller Enclosure Fan Sensor Dell Server Enclosure Fan Sensor Periodic Dell Storage Controller Enclosure Physical Disk Dell Server Enclosure External Physical Disk Periodic Dell Storage Controller Enclosure Power Supply Dell Server Enclosure Power Supply Periodic Dell Storage Controller Enclosure Temperature Sensor Dell Server Temperature Sensor Periodic Dell Storage Controller Internal P
Rules The following section lists the rules specific to the Server and Rack Workstation Monitoring (Licensed) feature. Dell Systems Event Processing Rules The Dell EMC Server Management Pack Suite processes rules from Dell servers. Dell Servers All informational, warning, and critical SNMP traps for Dell servers discovered using Server and Rack Monitoring (Licensed) feature, have a corresponding SNMP trap rule.
Task Description Launch Dell OpenManage Power Center Launches the OpenManage Power Center console for the selected system. NOTE: Launching OpenManage Power Center is possible only if the Windows or Linux operating system, OpenManage Server Administrator, and OpenManage Power Center are installed on the managed node. Launch Dell OpenManage Server Administrator (Monolithic Server) Launches the OpenManage Server Administrator console for the selected system.
To launch Dell License Manager: 1 In the OpsMgr console, navigate to a Dell Diagram Views, State Views, or Alerts Views. 2 Select the desired Dell server in any of the Diagram Views or State Views or an alert in the Alerts Views. 3 In the Task pane, select Dell Server Tasks > Launch Dell License Manager. Launch Dell OpenManage Power Center NOTE: Launching OpenManage Power Center is possible only if Windows or Linux operating system and OpenManage Server Administrator are installed on the managed node.
iSM using WMI This section describes how you can monitor Dell devices with iSM using Windows Management Instrumentation (WMI) to retrieve details from the supported Dell devices. This option provides scalable inventory and monitoring of the 12th, 13th, and 14th generation of PowerEdge servers, and supported Dell Precision Rack Workstations. For more information about the supported platforms, see the iDRAC Service Module Installation Guide at Dell.com/manuals. This is a licensed feature.
• Required version of iSM is installed on the managed node. NOTE: If you are monitoring devices through iSM using WMI feature on systems running Microsoft Nano server, see the section Installing iDRAC Service Module on Nano operating system in the iDRAC Service Module Installation Guide at Dell.com/support. • Windows Management Instrumentation (WMI) feature is enabled on the host.
Object discoveries for iSM using WMI Table 18. Objects discovered through iSM using WMI. Discovery Object Description Dell Server Discovery Classifies the Dell servers and populates the key attributes and components. Monitoring The Monitoring pane of the OpsMgr is used to select views that provide health information of the discovered Dell servers. The Severity Level Indicators helps you to indicate the health of the Dell servers on the network.
Hardware components Scalable Detailed iDRAC Network Interface Yes Yes Intrusion Sensor Group Yes Yes Intrusion Sensor No Yes Memory Group Yes Yes Memory Instance No Yes Network Interfaces Group Yes Yes Network Interfaces No Yes PCIeSSD Backplane No Yes PCIeSSD Physical Disk No Yes PCIeSSD Extender No Yes Processor Group Yes Yes Processor Instance No Yes Power Supply Group Yes Yes Power Supply Instance No Yes SD Card Group Yes Yes SD Card No Yes Storage Grou
Hardware components Scalable Detailed Storage Controller Virtual Disk Group No Yes Storage Controller Virtual Disk No Yes Storage Enclosure EMM Instance No Yes Storage Enclosure Power Supply Group No Yes Storage Enclosure Power Supply No Yes Storage Enclosure Sensors No Yes Storage Enclosure Temperature Sensor No Yes Storage Enclosure Temperature Sensor Group No Yes Teamed Network Interface Instance No No Sensors Group Yes Yes Temperature Sensor Group Yes Yes Temperature
Viewing Alerts on the OpsMgr Console To view the alerts on the OpsMgr console: 1 Launch the OpsMgr console and click Monitoring. 2 Click Dell > Alerts Views. The following alerts are displayed: 3 • Network Interface Alerts — Link-up and Link-down alerts from the discovered NICs are displayed. • Server and Rack Workstation Alerts — SNMP traps for 12th, 13th, and 14th generation of PowerEdge servers, PowerVault storage servers and Dell Precision Racks with iDRAC7, iDRAC8 or iDRAC9 are displayed.
Figure 4. Servers (iSM) Diagram Complete Diagram View The Complete Diagram View offers a graphical representation of all the supported Dell devices discovered and monitors in the OpsMgr. You can expand and verify the status of individual devices and their components in the OpsMgr.
• iDRAC License Group Modular Systems Diagram The Modular Systems Diagram View offers a graphical representation of all Modular systems and allows you to expand and verify the status of individual devices and their components in the diagram. Monolithic Servers Diagram The Monolithic Servers Diagram View offers a graphical representation of all Monolithic systems and allows you to expand and verify the status of individual devices and their components in the diagram.
• Dell Performance View (iSM) • Disk Performance - iSM (%) NOTE: All performance metric rules are disabled by default for Server and Rack Workstation Monitoring (Licensed) feature.
You can view the status for the following groups: • • Servers (iSM) Dell Server State Views • Sled Servers (iSM) The health of a component is derived by reviewing the unresolved alerts associated with the component. Severity Level Indicators explains the various state components that the Dell EMC Server Management Pack Suite uses with their corresponding severity levels.
server against the configured capacity threshold value. By default, this unit monitor is set to Disabled. To enable the Dell Server Capacity Check unit monitor, see the Enabling Dell Server Capacity Check unit monitor. The minimum threshold value is 1, and the maximum threshold value is 99. The default threshold value is 60. You can configure the threshold values within the specified range i.e 1–99.
You can view the details of the Server port connection information under iDRAC NIC and NIC objects in the Detail View pane of the Diagram View. Along with the inventory information of each NIC; chassis ID information of the switch and the port ID information is populated. This feature is available for servers discovered through both, the iDRAC and iSM methods of Server and Rack Workstation Monitoring (Licensed) feature. NOTE: This feature is supported for 14th generation of the PowerEdge servers only.
Object Unit Monitor Dell Server Current Sensor Health Periodic Dell Fan Sensor Dell Server Fan Sensor Health Periodic Dell Fan Sensor Group Dell Server Fan Group Sensor Health Periodic Dell Intrusion Sensor Dell Server Intrusion Sensor Health Periodic Dell Modular Blade Server With Operating System Dell Server Run As Account Association Periodic Dell Server Unit Monitor Periodic Dell Modular Blade Server Without Operating System Dell Server Run As Account Association Periodic Dell Server Unit
Object Unit Monitor Dell Server Host NIC Periodic Dell Server License Dell Server License Periodic Dell Server License Group Dell Server License Group Periodic Physical Network Interface Dell Server Network Interface Unit Periodic PCIe SSD Backplane Dell Server PCIeSSD Backplane Periodic PCIe SSD Extender Dell Server PCIeSSD Extender Periodic PCIe SSD Physical Disk Dell Server PCIeSSD Physical Disk Predictive Failure Disk Periodic Dell Server PCIeSSD Physical Disk Primary Status Periodic De
Object Unit Monitor Dell Server Enclosure Power Supply Periodic Dell Storage Controller Enclosure Temperature Sensor Dell Server Temperature Sensor Periodic Dell Storage Controller Internal Physical Disk Dell Server Internal Physical Disk Unit Periodic Dell Storage Controller Physical Disk Dell Server Controller Direct Attached Physical Disk Periodic Dell Storage Group Dell Server Storage Periodic Dell Storage Virtual Disk Dell Server Controller Virtual Disk Unit Periodic Dell Temperature Senso
Dell servers All informational, warning, and critical events for Dell servers discovered using Server and Rack Monitoring (Licensed) feature, have a corresponding event rule. Each of these rules are processed based on the following criteria: • Source Name = “Lifecycle controller Log” • Event no= Actual event ID of the event • Data Provider = Windows System Event Log Tasks Tasks are available in the Tasks pane of the OpsMgr console.
Task Description NOTE: Launching OpenManage Power Center is possible only if the Windows or Linux operating system, OpenManage Server Administrator, and Dell OpenManage Power Center are installed on the managed node. Launch Dell Remote Access Console Launches the iDRAC console for the discovered Dell servers and Rack Workstations that are License based. Launch Remote Desktop (Monolithic Server) Launches the remote desktop for the selected system.
Performing a remote iDRAC hard reset This section explains the steps to perform a remote iDRAC hard reset for a device discovered thorugh iSM using WMI. To reset the iDRAC remotely, you must first ensure that you have administrative privileges on the host OS. To reset the iDRAC remotely, perform the following steps: 1 Launch the OpsMgr console and click Monitoring. 2 Click Dell > State Views > Servers (iSM).
Launch Remote Desktop (Monolithic Server) NOTE: Launching remote desktop is possible only if the Windows operating system is installed and remote desktop is manually enabled on the managed system. NOTE: Remote Desktop task uses hostname to connect to the management server of a system. If the management server cannot resolve the hostname then, add the hostname and the IP address to a route to the server using its hostname that is configured on the management server.
5 DRAC Monitoring Feature DRAC monitoring feature supports discovery, and monitoring for the various generations of iDRAC—iDRAC6, iDRAC7, and iDRAC8 systems using SNMP. Topics: • • • • • Discovery and grouping Monitoring Dell Unit Monitors for DRAC Monitoring Feature Rules Tasks Discovery and grouping The Dell EMC Server Management Pack Suite enables you to discover and classify Dell Remote Access Controllers (DRAC), and integrated DRAC (iDRAC).
6 Enable the DRAC monitoring feature using Feature Management Dashboard. Scalability recommendation for OpsMgr When managing large number of network devices in a distributed setup, use dedicated resource pools of Management Servers for each device type, if the same Management Group is also used to manage devices discovered through the Server and Rack Workstation Monitoring feature. Discoveries by the DRAC Monitoring Feature Table 23. DRAC Monitoring Feature Discoveries.
Views Dell EMC Server Management Pack Suite provides the following types of views for monitoring, under Dell > Monitoring on the OpsMgr console: • Alerts Views • Diagram Views • State Views Alerts Views This view is available for managing hardware and storage events from Dell DRAC devices. SNMP traps and Platform Event Traps (PET) sent by DRAC devices are displayed by the DRAC monitoring feature.
Remote Access Controllers Group The Remote Access Controllers Group diagram view offers a graphical representation of all iDRAC6, iDRAC7, and iDRAC8 devices. Select a component in the diagram to view its details in the Detail View pane. Figure 5. Remote Access Controllers Group Diagram State Views This view is available for viewing the health of the Dell DRAC devices.
Object Unit Monitor Controller Global Status Event and Periodic Controller Global Storage Status Event and Periodic iDRAC7 Monolithic Dell Remote Access Status Event and Periodic Controller Global Status Event and Periodic Controller Global Storage Status Event and Periodic iDRAC8 Modular NOTE: For iDRAC8 modular and monolithic servers, the Dell RAC periodic-based and Dell RAC triggered-based unit monitors are disabled.
NOTE: Informational alerts are turned off by default. To receive these alerts, import informational alerts management pack. Tasks Tasks are available in the Tasks pane of the OpsMgr console. When you select a device or a component, the relevant tasks appear in the Tasks pane. Task summary Performing tasks using DRAC Following table provides a summary of the tasks that are performed using the DRAC: Table 25.
The task provides a summary of the reachability check, and interface check after the successful completion of the task. Launch Dell License Manager The Launch Dell License Manager task allows you to launch the Dell License Manager on management systems. Dell License Manager is a one-to-many license deployment and reporting tool for Dell iDRAC licenses. NOTE: If the Dell License Manager has not been installed in the default path, create a new task to launch Dell License Manager.
6 Chassis Monitoring Feature The chassis monitoring feature supports discovery and monitoring of Chassis Management Controller (CMC) on PowerEdge FX2/FX2s chassis, PowerEdge VRTX chassis, PowerEdge M1000e chassis, and Dell OEM Ready chassis using SNMP or WS-MAN protocol. Chassis monitoring feature also supports Detailed monitoring of individual chassis components in the supported OpsMgr.
For more information, see the OpsMgr documentation at technet.microsoft.com. NOTE: Select the Run As Account created for discovering the chassis devices. For more information, see the "Configuring Dell Chassis Management Controller feature for correlating Server modules with Chassis slot summary" section of the Dell EMC Server Management Pack Suite Version 7.0 for Microsoft System Center Operations Manager Installation Guide at dell.com/OMConnectionsEnterpriseSystemsManagement.
Table 28. Monitored hardware components — Scalable and Detailed feature.
Alerts Views This view is available for managing hardware and storage events from Dell CMC devices. SNMP traps sent by Chassis devices are displayed by the Chassis monitoring feature. Viewing Alerts on the OpsMgr console To view the Chassis monitoring alerts on the OpsMgr console: 1 Launch the OpsMgr console and click Monitoring. 2 Click Dell > Alerts Views. The following individual Alerts Views are displayed: 3 • CMC Alerts —SNMP traps from the discovered Chassis devices are displayed.
Chassis Management Controllers group The Chassis Management Controllers Group diagram view offers a graphical representation of all Dell CMC, PowerEdge FX2, PowerEdge M1000e, and PowerEdge VRTX, and their inventory. For the Chassis discovery, see the Discovering Chassis devices. Figure 6.
Performance and Power Monitoring Views NOTE: Chassis Power Consumption view is available only when the detailed feature of the Chassis Monitoring feature is installed, and the Chassis Performance Collection rule is enabled. By default, the Chassis Performance Collection rule is set to Disabled. To enable the rule, see Enabling Chassis Performance Collection Rule. To view the performance and power monitoring on the OpsMgr console: 1 Launch the OpsMgr console, and click Monitoring.
Object Unit Monitor Dell Modular Chassis Fan Dell Chassis Fan Health Poll Based Unit Monitor Periodic Dell Chassis Modular Controller Dell Chassis CMC Health Poll Based Unit Monitor Periodic Dell Chassis Modular Controller Group Dell Chassis CMC Group Health Poll Based Unit Monitor Periodic Dell Chassis Modular Power Supply Dell Chassis Power Supply Health Poll Based Unit Monitor Periodic Dell Chassis Modular Power Supply Group Dell Chassis Power Supply Group Health Poll Based Unit Monitor Period
Object Unit Monitor Dell Chassis Storage External Physical Disk Predictive Failure Health Status Poll Based Unit Monitor Periodic Rules The following section lists the rules specific to the Dell Chassis monitoring feature. Dell Systems Event Processing Rules The Dell EMC Server Management Pack Suite processes rules from Chassis traps. Chassis devices All informational, warning, and critical SNMP traps for the chassis devices have a corresponding SNMP trap rule.
c For information on creating a management pack, see the OpsMgr documentation at technet.microsoft.com. Click Create. d The management pack you created is selected in the Select destination management pack: drop-down menu. Click Apply. Tasks Tasks are available in the Tasks pane of the OpsMgr console. When you select a device or a component, the relevant tasks appear in the Tasks pane.
7 Chassis Modular Server Correlation Feature Chassis Modular Server Correlation feature supports: • Correlation of discovered Modular Servers using the licensed or license-free monitoring feature with Chassis slots. NOTE: CMC slot discovery is disabled by default. Hence, enable CMC slot discovery for the correlation feature to work. • Correlation of Chassis Shared Storage components with Dell servers.
8 Feature Management Dashboard The Feature Management Dashboard provides facilities for the configuration of the Dell EMC Server Management Pack Suite monitoring features to monitor the various Dell systems—Dell servers, Dell Precision Racks, Dell Remote Access Controllers (DRAC), PowerEdge FX2/ FX2s, PowerEdge VRTX, PowerEdge M1000e, and integrated DRAC (iDRAC).
NOTE: • In the Event log, ignore the errors pertaining to reimporting of existing management packs. These errors occur when Feature Management Dashboard reimports all the dependent management packs that were already imported while importing a monitoring feature. • Wait for a task to complete (view the state update change in the dashboard) before launching another task using the Feature Management Dashboard.
Tasks Description Server and Rack Workstation Monitoring Enable Agent Proxying Enables agent proxying for Dell servers. Import Detailed Feature Imports the Detailed feature of the Server and Rack Workstation Monitoring feature. Import Scalable Feature Imports the Scalable feature of the Server and Rack Workstation Monitoring feature. Refresh Dashboard Updates the Feature Management Dashboard. Refresh Node Count Updates the node count.
Tasks Description Remove Monitoring Feature (Licensed) Removes the Server and Rack Workstation Monitoring (Licensed) feature.
9 Licensing for Dell EMC Server Management Pack Suite License Information The Server and Rack Workstation Monitoring (Licensed) feature in Dell EMC Server Management Pack Suite for OpsMgr is licensed. Information on the process for obtaining software licenses is as follows. Licenses Licenses must be purchased based on the desired number of nodes you want to monitor.
10 Related documentation and resources This chapter gives the details of documents and references to help you work with Dell EMC Server Management Pack Suite.
Accessing Documents From Dell Support Site To access the documents from Dell Support site: 1 Go to dell.com/support/manuals. 2 In the Tell us about your Dell system section, under No, select Choose from a list of all Dell products and click Continue. 3 In the Select your product type section, click Software and Security.
11 Appendix A—Issues and resolutions Issues and resolutions The following table lists the known issues, resolutions, and where the issues are applicable: Table 34. Issues and resolutions Issue Resolution Applicable To Discovery through iSM using WMI fails when a managed node is running Windows Server 2008 R2 and the Management server is running OpsMgr 2012 R2. Ensure that you have installed Windows Management Framework version 4.0. Server and Rack Workstation Monitoring (Licensed) Feature.
Issue Resolution b Applicable To Disable the object discovery corresponding to the method used for discovering the modular servers. For example: If the duplicate object is discovered through OMSA, then navigate to Authoring > Object Discoveries and then search for Dell Server Discovery; which is targeted at the Windows Computer and disable the Discovery attribute for that object.
Issue Resolution Server Modules and Chassis Slot Summary Information are not visible under CMC. • • • Applicable To Make sure that OpenManage Server Administrator (OMSA) or DRAC tools are installed on the management server managing the CMC. Make sure that you have configured the Run As Account for CMC devices and associated them with "Dell CMC Login Account". Make sure that Dell CMC Slot Discovery and rules are enabled from the Authoring Pane of the OpsMgr console.
Limitation Applicable to view it, you can see the username and the password you specified. The credentials are not hidden when you view the task. While using health explorer, some unit monitors in Dell EMC Server Management Pack Suite (under Sensors and OpenManage Services instances) may display a green status though the subinstance does not exist. This is because unit monitors cannot have an Unavailable state when the target class is present and the unit monitor has been executed.
12 Appendix B Creating a Simple Authentication Run As Account 1 Log on to OpsMgr as an administrator for the OpsMgr Management Group. 2 On the OpsMgr console, click Administration. 3 Click Run As Configuration > Accounts. 4 Right-click Accounts, and then click Create Run As Account. The Create Run As Account Wizard screen is displayed. 5 Click Next. 6 From the Run As account type: drop-down menu, select Simple Authentication. 7 Provide a display name in the Display name: text box.
7 Select the run as account used to discover the Dell server from the Run As Account: drop-down list. NOTE: If you are using multiple Run As Account to discover devices, associate each device with its associated Run As account. 8 Click. A selected class, group, or object and add the association for the server in the SMASH Monitoring Profile. • Click Select > Class option, use Dell server as the selection. • Click Select > Group option, use the group containing the Dell server objects as the selection.
13 Appendix C - Enabling External Program Tasks For tasks provided by the Dell EMC Server Management Pack Suite that launch external programs have to be installed in the default location. Create new tasks to launch the application if the program is not installed in the default location.
• power soft (for Power Off Gracefully task) • power off (for Force Power Off task) • power cycle (for Power Cycle task) • power reset (for Power Reset task) • identify on (for LED Identification On task) • identify off (for LED Identification Off task) Example: -I lanplus -H $Target/Property[Type="Dell.WindowsServer.