
Users Guide

Managing reports
This chapter provides information on periodically generating reports for inventory and monitoring and managing the reports.
Pre-defined templates are provided to help you generate the reports. By default, the reports are generated in HTML format. You
can download the reports in XML or CSV format.
In the left pane, click Reports. The Reports screen is displayed. On this screen, you can:
● View report details
● Create reports
● Edit reports
● Delete reports
● Refresh the reports list
● Add or edit report groups
● Set estimated max power
● Filter reports
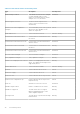
The following types of reports can be generated using OpenManage Power Center:
● Power Hoarders — The Power Hoarder report displays the devices that are the largest consumers of power. The result is
calculated considering the highest average power consumption of the devices over a specific time period.
● Power Frugal — The Power Frugal report displays the devices that are the least consumers of power. The result is
calculated considering the lowest average power consumption of the devices over a specific time period.
● Power Data — The Power Data report displays the power consumption data for the selected devices or device groups. The
data comprises of the minimum, maximum, highest or lowest average power consumption.
● Power Headroom — The Power Headroom report displays the total power consumption and the unused power data for the
selected devices or device groups.
● General Inventory — The General Inventory report displays the inventory data for the selected devices or device groups.
● Power Hoarders Rack — The Power Hoarders Rack report displays the rack devices that are the maximum power
consumers. The result is calculated considering the lowest headroom of the devices over a specific time period.
● Power Frugal Rack — The Power Frugal Rack report displays the rack devices that are the least power consumers. The
result is calculated considering the highest headroom of the devices over a specific time period.
● Raw Monitoring Data — The Raw Monitoring Data report displays the monitoring data for the selected devices or device
groups.
● Comparison Report — The Comparison report displays the result obtained on comparing a minimum of two or a maximum of
three devices or device groups.
● Thermal Data — The Thermal data report displays the observed temperature values for the selected devices or device
groups.
● Power Utilization — The Power utilization report displays the power utilization for the selected devices or device groups.
● Power Threshold Violations — The Power threshold violation reports displays the information about the power threshold
violations for the selected devices or device groups.
● Power Cap Violations — The Power cap violations report displays the violations observed in the device or the device group
power cap level.
● Power Cap Settings — The Power cap settings report displays the settings of the device or the device group power cap
level.
● Threshold Settings — The Threshold settings report displays the threshold settings of the device or the device group.
● Rack Fragmentation Hoarders — The Rack fragmentation hoarders report displays the racks that are the most fragmented.
● Rack Space Hoarders — The Rack space hoarders report displays the racks with the highest rack space utilization.
● Rack Space Frugal — The Rack space frugal report displays the racks with the lowest rack space utilization.
● Highest Temperature — The Highest temperature report displays the devices that has the highest temperature.
● Lowest Temperature — The Lowest temperature report displays the devices that has the lowest temperature.
● Events Reports — The Events report displays the events with a specified severity level for a specified time-period.
● PDU Outlet Assignment — The PDU outlet assignment report displays the PDU name, PDU IP, PDU location, PDU outlet
assignment and other relevant details.
● PDU Sensor Report — The PDU sensor report displays the PDU environment sensors information and other relevant details.
13
Managing reports 85