
Users Guide
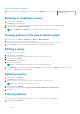

Table 5. Time Windows and Intervals (continued)
Time Window Description Interval
1Y 1 year 2 weeks
NOTE: This table lists the interval when the sampling interval is at the default value (1 minute). Changing the sample
interval results in interval changes for the 15Min and 1H time windows. If you change the sampling interval to 3 minutes, the
interval of the 15Min time window is 3 minutes. If you change the sampling interval to 6 minutes, the interval of the 15Min
time window is 3 minutes and the interval of the 1H time window is 6 minutes.
Temperature Details for a Different Time Window
Click the arrows < > to view the details for the previous/next sampling time, or click the double arrows << >> to view the details
for the previous/next page of results for the current time window. You can click Average, Maximum, or Minimum to display the
selected value.
● Average: The average value from the previous time point to the current time point.
● Maximum: The maximum value from the previous time point to the current time point.
● Minimum: The minimum value from the previous time point to the current time point.
For example, you view temperature details in the 1H (1 hour) window and the maximum value at 15:00 shows 40°C and the time
interval is 6 minutes. This value would represent that the maximum temperature from 14:54 to 15:00 is 40°C.
Chassis Details
The Chassis Details table appears when you select a chassis on the Devices screen. Chassis Details lists all blade servers
within the chassis and their temperature details in a table, including:
● Device: Device name.
● Average: The average value of the latest sampling interval.
● Maximum: The maximum value of the latest sampling interval.
● Minimum: The minimum value of the latest sampling interval.
NOTE:
You can set the time interval (the period from a time point to the next time point) in the Settings > General page.
For information on configuring the interval, see Monitoring Settings.
NOTE: The Average, Maximum, or Minimum field displays NA if no data is available—for example, when the blade server
is an Unsupported device.
Viewing a temperature history graph
OpenManage Power Center provides a visual representation of the temperature history of your system devices.
1. In the left pane, click Devices > All Devices or Devices > Managed Group.
2. From the list of devices, select a device.
The details of the device are displayed in the Details section.
3. In the Details section, click the Thresholds tab.
Alternately, you can also click Thermal History in the Summary tab.
4. Click View History next to Average Inlet Temperature Alert Thresholds.
The Thermal History — <device> Group window is displayed.
5. Select the time period and attributes displayed:
a. To select the time period represented in the graph, click the buttons along the top of the graph.
b. To add or delete attributes, select from the listed options; click the option to toggle its addition or removal from the
graph:
72
Temperature Monitoring