
Users Guide

Power details for racks
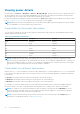
For racks, you can click Devices > Managed Group > Details to display PDU power consumption for all rack PDUs.
You can also click Devices > Managed Group > Policies to change a power policy.
You can view the following power details of PDU devices. For more information on supported PDU devices, see System
Requirements.
● PDU device information, including PDU name, model, and IP address.
● PDU outlet information, including outlet number, power (W), voltage (V), amps (A), and the time of the information
recorded, following the format <YYYY-MM-DD HH:MM:SS>. The table lists the information for each outlet and the total
power consumption for all outlets.
Viewing Energy Consumption
Details of each device and device group power consumption are available in the power history graph.
● IT Equipment Energy — The total energy consumption and cost for all managed devices in the selected device or device
group.
NOTE: Power Center can read the power consumption of a device when it as at S0 (On) state. For devices in S4/S5 state,
Power Center uses a fixed value (30W) to calculate the power consumption.
● Cooling Energy — The estimated energy consumption and cost needed to cool the selected device/group.
Cooling Energy = IT Equipment Energy * Cooling Multiplier
You can configure the cooling multiplier on the Settings > Monitoring screen, in the Energy Consumption Cost section.
● Energy Consumed (Total) — The combined energy consumption and costs for the IT equipment and cooling energy. The
formula is:
Cost = (IT Equipment Energy T1*Cooling Multiplier) *Flat Rate T1+(IT Equipment Energy T2*Cooling Multiplier) *Flat Rate
T2+°¦+(IT Equipment Energy Tn*Cooling Multiplier) *Flat Rate Tn
NOTE: T1/T2/.../Tn is the time period (in hours) at a certain flat rate.
NOTE: By default, the Cost column displays 0. You must configure the cost rate to see the cost. The rate is a global
setting, and can be set on the Settings > Monitoring page.
NOTE: The Energy Consumption Cost section displays information based on the values configured in the Settings
screen. This information should be used as an estimate only.
NOTE: When a device or group is newly-added or created in Power Center, the power and energy consumption data
displayed in the "1W" and "1M" time windows are different if the monitored time is less than 1 week, and the data
displayed in the "1H" and "1D" time windows are different if the monitored time is less than 1 day. This occurs because
Power Center uses different sampling intervals for different time windows. For example, a device is added into Power
Center at 2011-10-15 09:00, and the current time is 2011-10-17 11:10. For the 1M time window (sampling interval is 1 day),
the power and energy consumption is calculated from 2011-09-17 00:00 to 2011-10-17 00:00. For the 1W time window
(sampling time is 1 hour), the power and energy consumption is calculated from 2011-10-10 11:00 to 2011-10-17 11:00.
There is an 11 hour gap; therefore, the data displayed in the two time windows are not the same.
Viewing a power history graph
OpenManage Power Center provides a visual representation of the power history of the system devices.
1. In the left pane, click Devices > All Devices or Devices > Managed Group.
2. From the list of devices, select a device.
The details of the device are displayed in the Details section.
3. In the Details section, click the Thresholds tab.
Power Monitoring
69