
Users Guide
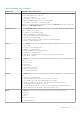

Events (Top 5 Groups)
On the Home page, you can view a bar graph representation of the top five device groups, that have the highest number of
events with severity as Critical, followed by the events that has the events with severity as Warning and Information. Move
the pointer over the graph to view the number of each event type for the top-five device groups.
Devices Discovered [Total: <number>]
On the Home page, you can view a pie graph representation of the total number and type of discovered devices.
Energy Consumers (Top 5 Groups) [kwh]
On the Home page, you can view a bar graph representation of the top five energy consuming device groups at the root level.
Click
to specify the number of months for calculating the peak power consumption. By default, the number of months is 6.
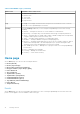
Power Headroom
OMPC enables you to monitor and manage the available excess power in a top-level group. The observed monitoring data is
helpful in planning capacity expansion.
Space Headroom
OMPC enables you to monitor and manage the available excess space in a data center. The observed monitoring data is helpful
in providing placement suggestion.
Top Offenders (Power)
This option enables you to view the names of the racks that exceeded the power threshold.
Top Offenders (Temperature)
This option enables you to view the names of the racks that exceeded the Temperature threshold. Click Actual or Percentage
to arrange the devices or groups by the actual amount or percentage by which the racks have exceeded the temperature
thresholds or caps.
Underutilized Racks
This option enables you to view the names of the racks in which the power capacity and rack space remain unused. Click Actual
or Percentage to arrange the racks by the actual or utilization percentage of power and rack space.
Top 10 (Most Recent) Critical and Warning Events
This option enables you to view the recent top 10 critical and warning events.
Customizable Dashboard Settings
This option enables you to customize the dashboard available on the home page. You can select individual information referred
as dashlets, from a list of predefined set of dashlets. Click
to select the required dashlets.
Getting started
15