
Users Guide
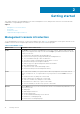
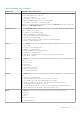
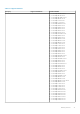
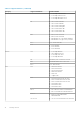
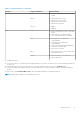

Table 2. Main OMPC Pages (continued)
Main Screen Available actions on the screen
● Add a note to an event
● Delete Events
● Sort events
● Filter events
● Export Events
Logs The Logs screen displays information about unexpected or informational events or internal
errors that occur in OpenManage Power Center.
Settings From the Settings submenus you can configure all OpenManage Power Center settings,
including:
● General — Configure the timeout for console and device communication.
● Monitoring — Configure the power/thermal units and energy consumption parameters.
● Alerts — Configure alerts for SNMP traps, enable or disable sending alerts through emails,
configure email recipients, and event severity-level.
● SMTP — Configure SMTP parameters for sending alert emails.
● Database — Configure database compression and purging policy.
● Directory — Configure Lightweight Directory Access Protocol (LDAP) settings to support
authentication through LDAP. This tab is displayed only on systems running the Linux
operating systems where OpenManage Power Center is installed.
● User and Group Accounts — Manage user or group accounts for accessing OpenManage
Power Center.
● Roles — Managing roles and rights.
● Licensing — Manage the issued licenses.
● Inventory — Track chassis inventory.
Home page
On the Home page, you can view the following information.
● Events (Overall)
● Events (Top 5 Groups)
● Devices Discovered [Total: <number>]
● Energy Consumers (Top 5 Groups) [kwh]
● Power Headroom
● Space Headroom
● Top Offenders (Power)
● Top Offenders (Temperature)
● Underutilized Racks (Power)
● Underutilized Racks (Space)
● Top 10 Events (Critical and Warning)
● Power History
● Temperature History
Events
On the Home page, you can view a pie graph representation of events occurring in OpenManage Power Center. Move the
pointer over the graph to view the number of each event type.
14
Getting started