
Users Guide
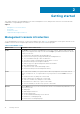
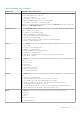
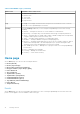
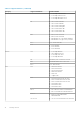

Table 2. Main OMPC Pages (continued)
Main Screen Available actions on the screen
● Refresh the list of devices or managed groups
● Filter and search the list of devices
● Sort the list of devices
● Move devices from one group to another
● Enable or disable Emergency Power Reduction (EPR)
● View details of the devices or managed groups
All devices, whether grouped or unassigned are listed in the All Devices tab. Device groups are
displayed in the Managed Groups tab.
Virtual Machines On the Virtual Machines screen, you can view both network-discovered and manually added
devices. On this screen you can:
● Create a new virtual machine group
● Add a virtual machine to an existing group
● Filter virtual machines based on various attributes
● Move a virtual machine group
● View a virtual machine power history and power distribution graph
● Delete a virtual machine group
Policies On the Policies screen, you can manage the power policies applied to your devices. On this
screen you can:
● Create power and thermal policies
● Edit power or thermal policies
● Enable or disable power or thermal policies
● Delete power or thermal policies
● Filter power or thermal policies so that only certain policies are displayed
● Sort the list of policies
Reports The Reports screen helps you to periodically generate reports for inventory and monitoring. On
this screen you can:
● Create reports
● Edit reports
● Delete reports
● Refresh the Reports list
● Add or edit report groups
● Set estimated max power
Analysis The Analysis screen helps you to analyze power and thermal characteristics. On this screen you
can:
● Analyze server characteristics
● View, filter, and export peak power or active idle power reports
● View, analyze, filter, and export underutilized servers reports
● Identify the number of servers that can be accommodated in a specific group
● View placement recommendation for servers
● Estimate the power and space you can save by consolidating the underutilized servers
● Identify and analyze the potential cooling issues in a data center
Events The Events screen lists the system and log events at the following severity levels:
● Critical
● Warning
● Info
On this screen you can:
● Acknowledge Events
Getting started 13