Dell EMC OpenManage Power Center 4.1 User’s Guide September 2018 Rev.
Notes, cautions, and warnings NOTE: A NOTE indicates important information that helps you make better use of your product. CAUTION: A CAUTION indicates either potential damage to hardware or loss of data and tells you how to avoid the problem. WARNING: A WARNING indicates a potential for property damage, personal injury, or death. © 2019 Dell Inc. or its subsidiaries. All rights reserved. Dell, EMC, and other trademarks are trademarks of Dell Inc. or its subsidiaries.
Contents Chapter 1: Overview...................................................................................................................... 8 Key features..........................................................................................................................................................................8 New in this release..............................................................................................................................................................
Managing user roles and privileges............................................................................................................................... 42 Adding a custom role.................................................................................................................................................. 42 Editing a role.................................................................................................................................................................
Adding a virtual machine to an existing group........................................................................................................... 65 Moving a virtual machine group.................................................................................................................................... 65 Viewing a virtual machine power history graph.........................................................................................................
Cooling Analysis................................................................................................................................................................. 83 Configuring cooling analysis settings......................................................................................................................83 Viewing a hot spot room............................................................................................................................................
Alerts...................................................................................................................................................................................107 Setting SNMP traps.................................................................................................................................................. 107 Sending SNMP traps to a Third-Party Application............................................................................................
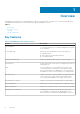
1 Overview OpenManage Power Center is a power management solution for the data center. It enables you to monitor and manage power consumption and temperature in your data center through the management console. Topics: • • • • Key features New in this release Topology System requirements Key features Table 1.
Table 1. OpenManage Power Center features (continued) Feature Description and device groups. The formula for calculating stranded power is: Stranded Power(t) = Allocated Power(t) Peak Power Consumption(t) where (t) is calculated as a function of time. You can specify a time range in the report. By default, (t) is the time range of monitored data. Power and Thermal Analysis Enables you to analyze power and the thermal characteristics.
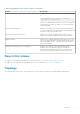
Figure 1. OMPC Topology System requirements This section describes the general requirements of OMPC and provides information on supported operating systems and the basic system requirements for server system and devices that use OMPC. Hardware and software requirements for the server system Hardware requirements You must install Power Center on a system with at least: ● ● ● ● A dual-core processor of 2.
● ● ● ● ● ● ● ● ● ● ● ● ● ● ● Microsoft Windows Server 2012 R2 Essentials Edition Microsoft Windows Server 2012 R2 Standard Edition Microsoft Windows Server 2012 R2 Datacenter Edition Microsoft Windows Server 2016 Standard Edition Microsoft Windows Server 2016 Data Center Edition Microsoft Windows Server 2019 Standard Edition Microsoft Windows Server 2019 Data Center Edition Microsoft Windows 8.1 Professional Microsoft Windows 8.1 Enterprise Microsoft Windows 10 Professional Red Hat Enterprise Linux 6.
2 Getting started This chapter introduces the OpenManage Power Center management console, and presents several use cases that describe standard uses of OpenManage Power Center. Topics: • • • • Management console introduction Home page Common use cases Supported and unsupported devices Management console introduction To use OpenManage Power Center, you must open a Web browser and log in.
Table 2. Main OMPC Pages (continued) Main Screen Available actions on the screen ● ● ● ● ● ● Refresh the list of devices or managed groups Filter and search the list of devices Sort the list of devices Move devices from one group to another Enable or disable Emergency Power Reduction (EPR) View details of the devices or managed groups All devices, whether grouped or unassigned are listed in the All Devices tab. Device groups are displayed in the Managed Groups tab.
Table 2. Main OMPC Pages (continued) Main Screen Available actions on the screen ● ● ● ● ● Add a note to an event Delete Events Sort events Filter events Export Events Logs The Logs screen displays information about unexpected or informational events or internal errors that occur in OpenManage Power Center. Settings From the Settings submenus you can configure all OpenManage Power Center settings, including: ● General — Configure the timeout for console and device communication.
Events (Top 5 Groups) On the Home page, you can view a bar graph representation of the top five device groups, that have the highest number of events with severity as Critical, followed by the events that has the events with severity as Warning and Information. Move the pointer over the graph to view the number of each event type for the top-five device groups. Devices Discovered [Total: ] On the Home page, you can view a pie graph representation of the total number and type of discovered devices.
Power History A visual representation of the power history of the system groups. Temperature History A visual representation of the temperature history of the system groups. Common use cases This section provides a standard scenario to help Administrators to get started with OpenManage Power Center. If you are a first-time user, you can follow the sequence of steps 1-5 to install OpenManage Power Center and set up the group structure for monitoring your data center.
Table 3.
Table 3.
Table 3.
3 Using OpenManage Power Center This chapter explains how to install, uninstall, and launch OpenManage Power Center on Microsoft Windows and Linux platforms. Topics: • • • Preinstallation requirement for OpenManage Power Center Using Power Center on Microsoft Windows operating systems Using OpenManage Power Center on Linux operating systems Preinstallation requirement for OpenManage Power Center Ensure that you assess the following before installing OMPC. ● Administrator privileges.
● Not case-sensitive 6. Enter the password in the Password text box and then, in the Verify Password text box to confirm it. NOTE: The password must be a minimum of eight characters, with characters from at least three of the following categories: uppercase, lowercase, numeric, and non-alphanumeric. If you want to customize the installation, select the Custom Install check box and proceed to step 7 else, proceed to step 10. 7.
● external — Other applications installed by OpenManage Power Center ● Logs — OpenManage Power Center event logs ● Pgdata (default) — Database files To protect data, the following files are accessible only to Network Service or Administrator users: ● OpenManagePowerCenter\conf\app.config.xml ● OpenManagePowerCenter\external\apache-tomcat\conf\server.
Uninstalling OpenManage Power Center on Microsoft Windows operating system Before you uninstall OpenManage Power Center ensure to remove all devices from the Power Center management console. Otherwise, the existing power cap value set in the policies (including EPR) remains effective on the devices. NOTE: Ensure to check your data center power capacity before removing the devices to avoid tripping the breaker, because the policies will be removed at the same time. 1.
4. Under Properties, locate IE Enhanced Security Configuration; click the On or Off radio buttons for both Administrators and Users as desired to enable or disable the feature for those groups. 5. Click OK to save your selections. Configuring ESC to Trust the Power Center Site and Links 1. Go to Internet Explorer > Tools > Internet Options > Security. 2. Click Trusted Sites, and add about: Blank as a trusted site. NOTE: You may need to restart Internet Explorer for the configuration to take effect.
● PostgreSQL Data Directory—The location of PostgreSQL data. Press to continue. NOTE: You must create a super user account to log into OpenManage Power Center following installation. 9. Create a super user account. a. Type 1, then enter a super user account name. The account name must be: ● Unique for each Power Center user ● Up to 20 uppercase or lowercase printable characters, except “/\[]:;|=,+'*?<>.@ ● Not case sensitive b. Type 2, then enter a password for the super user account.
Uninstalling Power Center in Linux NOTE: Ensure to remove all devices from the OpenManage Power Center console before uninstalling Power Center. Otherwise, the existing power cap value set in the policies (including EPR) will remain effective on the devices. Ensure to check your data center power capacity before removing the devices to avoid tripping the breaker, because the policies are also removed at the same time.
4 Using OpenManage Power Center through Command Line Interface All commands supported by the command line interface (CLI) have the following format: ompc_cli [COMMAND] [GENERIC_OPTIONS] [COMMAND_OPTIONS] [COMMAND_TARGET] The operation must start with a valid [COMMAND]. Options can be entered anywhere after [COMMAND]. For each option that has a value, the value must be supplied immediately after the option.
Command Line Interface commands This section lists the commands used to work with OMPC. In the following commands, [ ] represents optional attributes and < > represents variables. All command line text is case insensitive. help Usage: ompc_cli help [] [] The help command prints the help content for a command or a command option (including the generic option). Authentication is not required for the help command.
● https_port ● https_user ● https_password ● https_validate_cert (its value must be true or false) For SSH, the properties are: ● ssh_port ● ssh_user ● ssh_password ● ssh_validate_cert For SNMPv1v2c, the property is snmp_community_string. (Required).
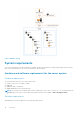
update_device Usage: ompc_cli update_device [-description ] [-size ] [-estimated_max_power ] [-host_name ] [-ip ] [] [] The update_device command updates device information identified by its device_name. If new_device_name is provided, the device_name is also updated to the new_device_name.
add_group Usage: ompc_cli add_group [-description ] -group_type [-capacity ] [-total_power_capacity ] GROUP_PATH The add_group command adds a new group identified by GROUP_PATH. If the type is RACK, you must supply the option. Forward slash (/) cannot be used as GROUP_PATH in the add_group command. The chassis can be added to any group at any time. You can only add Chassis Management Console (CMC) to one rack; not multiple racks.
If new_group_name is provided, the CLI updates the name of the group to the new name. The group can belong to another group. If this is the case, the rename operation may fail because of the name confliction. The chassis can be regarded as group, so the CLI allows updates to the properties of the chassis through the update_group command. You can only update the chassis’ description and name through the update_group command. You cannot update other types of groups to be a chassis.
When moving a UPS/PDU from one rack to another rack and the slot is not provided: ● If the UPS/PDU is in a slot of a previous rack, the CLI selects one slot in the new rack. ● If the UPS/PDU is attached in a previous rack, the CLI attaches it in the new rack. When moving a UPS/PDU from one rack to another rack and you have specified the slot: ● If the UPS/PDU is in a slot of a previous rack, the CLI uses the specified slot in the new rack.
● Fields containing double quotes and commas must be enclosed in double quotes. ● If a double quote appears inside a field, it must be escaped by preceding it with another double quote. For example: “aaa”, “b””bb”, “ccc”. list_device_props Usage: ompc_cli list_device_props [-service_tag ] [] The list_device_props command lists all properties for the device identified by servtag or device_name.
list_report_groups Usage: ompc_cli list_report_groups The list_report_groups command is used to list all report groups. Each report group is output in one row containing these fields: report_group_name, description and created_by. list_reports Usage: ompc_cli list_reports [REPORT_GROUP] The list_reports command is used to list user defined reports. REPORT_GROUP is the name of a report group. If no REPORT_GROUP is supplied, all reports are listed.
After a discovery is complete, the discovered devices are added to OpenManage Power Center automatically and the count is displayed in the console. If the device discovery fails, an error message is displayed. backup_database Usage: ompc_cli backup_database -path -encrypt_password [-quiet] The backup_database command is used to initiate the OMPC database backup. The -path and -encrypt_password options must be supplied.
Command line interface error codes An error code appears when one of the following two conditions occurs: ● The CLI identified an error, such as a command or command option validation error. The error code is generated by the CLI. The module number for the CLI is 0xEE. An error number for each command and option is displayed. ● An OpenManage Power Center back-end error occurs. In this situation, the error code from the server is returned by the CLI.
5 Access control This chapter provides information about access control in OpenManage Power Center, including: ● Log in/Log out — Log into OpenManage Power Center by entering user account credentials. ● User/Role/Privilege Management — After logging in, you can manage user accounts from the Settings > Users screen of the management console. OpenManage Power Center provides role-based access control; to use these controls, set up roles first, and then define the privileges for each role.
● Windows Local Account — Windows local account on the OpenManage Power Center server. ● Linux Local Account — Linux local account on the OpenManage Power Center server. NOTE: OpenManage Power Center requires that SSL is enabled at the LDAP server, if not, the authentication fails. NOTE: LDAP authentication must be enabled in the Directory Settings screen. See Editing Directory Settings.
NOTE: Kerberos SSO may not work if you launch Power Center services using an account other than Network Service. Single domain environment You can set up a single domain environment with the following components: ● Domain Controller — AD server that supports the domain (parent and child) ● Power Center Server — Server with Power Center installed ● Power Center Client — Client server that connects to the Power Center server Figure 2.
Figure 3. Multiple domain environment To set up the Kerberos SSO multiple domain environment: 1. Install Power Center. 2. Configure your web browser for SSO. Windows NT LAN Manager (NTLM) authentication limitation OpenManage Power Center supports Kerberos SSO for Windows domain user authentication. To enable this feature, OpenManage Power Center is configured to support the Windows integrated authentication option which includes two authentication mechanisms: Kerberos and NTLM .
Managing user roles and privileges OpenManage Power Center supports three pre-defined roles: ● Administrator: All privileges ● Power User: All privileges except Manage role/user and Manage license ● Guest: View device/group privileges only These pre-defined roles cannot be edited or deleted. NOTE: Only users with the Role/User Management privilege can add, edit, or delete a role or user or group account. Adding a custom role 1. In the left pane, click Settings > Roles. 2. Click Add a Role.
3. Click Yes to confirm the deletion, or click No to discard the delete task. Privileges Each pre-defined role is associated with a set of specific privileges.
● The Run Discovery task is not available. ● Add/Edit/Delete functionality is disabled on the Devices screen.
Manage Report The Manage Report privilege enables a user to: ● Manage reports ● Add reports ● Delete reports ● Export reports Execute power task The Execute Power Task privilege enables a user to: ● Create power control tasks ● Perform power control task Manage power task The Manage Power Task privilege enables a user to: ● Manage power control tasks ● View power control task ● Edit power control task ● Re-run power control task ● Stop power control task ● Delete power control task Backup Database The Ba
4. Select Account Type and enter the required credentials: The available options are: For both Windows and Linux installations: ● OMPC Account ○ Enter a unique User Name for the account. ○ Enter a Password that is at least eight characters long and includes characters from at least three of the following categories: uppercase, lowercase, numeric, and nonalphanumeric. ○ Re-enter the password in the Verify Password text box to confirm.
Editing a user or group account 1. In the left pane, click Settings > Users. 2. Select the check box next to the user or group account that you want to edit, then click Edit. The Edit a User or Group Account window is displayed. 3. Make the required changes, then click Save to save your changes, or click Cancel to discard them and return to the Users tab. Deleting a user or group account NOTE: You cannot delete the Power Center managed user (super user) created during installation. 1.
6 Task management The Tasks feature enables you to perform device discovery and power control tasks such as power-on and power-off, on a specific device or a group of devices. In the left pane, click Tasks. The Tasks screen comprises the following tabs: ● Discovery Tasks ● Power Control Tasks By default, the Discovery Tasks tab is displayed.
After a device is discovered, it is automatically added to the Devices > All Devices tab. The device can be assigned to a group and managed by OpenManage Power Center. After you have created a discovery task, you can also re-run the task when needed. Discovery tasks can also be scheduled to run later or run immediately. Creating discovery tasks You can create discovery tasks using the New Discovery Task wizard. 1. In the left pane, click Tasks > Discovery Tasks > New Discovery.
Power control tasks Power control tasks help you to mange the power-on or power-off of devices. You can schedule the time at which the power control tasks must be performed on the devices or device groups. Creating power tasks You can create power tasks using the Power Task wizard. 1. In the left pane, click Tasks > Power Control Tasks > New Task. The Power Task wizard is displayed. 2.
○ Port — A string of 40 hex digits. ○ Validate Certificate — (Optional) Enables certificate validation. NOTE: By default, OpenManage Power Center uses port 8643 for power center application and port 8644 for redfish HTTPS events. You also have the option to use a different port apart from the default port. NOTE: In OMPC 4.0, there are restrictions in using Redfish protocol with the lockdown feature of iDRAC enabled. For more information, see Troubleshooting chapter.
have access only to the iDRAC login privilege. For more information on the roles and iDRAC privileges, see the iDRAC Redfish reference guide. In OMPC, you can discover and manage devices by using multiple protocols. For example, to manage servers-you can use the IPMI or the Redfish protocol. OMPC does not change the protocol in use for devices discovered earlier.
● Hypervisor ○ HTTPs Protocol ○ WMI Protocol NOTE: By default, OpenManage Power Center uses port 8643 for power center application and port 8644 for redfish HTTPS events. You also have the option to use a different port apart from the default port. 5. Click Finish. Editing a protocol You can edit the protocol information of a device. 1. In the left pane, expand Tasks and click Protocols. The Protocols screen is displayed. 2. Select the check box next to the protocol profile name you want to edit. 3.
7 Device Management The Devices feature enables you to view and manage the network-discovered devices and devices added manually. You can also categorize the devices into groups. In the left pane, click Devices. The Devices screen is displayed and comprises the following tabs: ● All Devices ● Managed Groups By default, the All Devices tab is displayed. You can also view the details of a specific device or device group at the bottom section of the Devices screen.
The Add New Device window is displayed. 2. Enter the name of the device you want to add in the Device Name text box. 3. Enter a valid IP address in the IP Address text box or the hostname and device model number in the Hostname and Model text box respectively. 4. From Additional Information (Optional) > Size of Device (U) drop-down list, select the size of the device you want to add, in rack units (U). 5. Enter a description for the device in the Device Description text box. 6.
2. In the task menu, click Filter. The Device Filter window is displayed. 3. Select the filter by clicking Select Filter drop-down list. 4. (Optional) Enter a name for the filter in the Filter Name text box. 5. Do one of the following: ● Select the IP Range check box, and enter the start and end IP address of devices. ● Select the Date Range check box, and enter the start and end date of device discovery. Enter the dates manually following the format MM/DD/YYYY, or select the dates from the calendar.
OR ● Click Run Once to view a filtered list of devices. OR ● Click Cancel to return to the All Devices tab. You can use the saved filters later. Editing a device You can edit devices or device groups from the Devices screen. 1. In the left pane, click Devices. 2. Select the check box next to the device or device group that you want to edit. 3. Click Edit. The Edit Entity screen is displayed. 4. Make the required changes.
Updating Device location OMPC enables you to replicate and update the physical organization and hierarchy of a data center. Using OMPC you can place servers in the hierarchy specified on iDRAC/CMC. Only servers for which the values have been populated in the following hierarchy — Data Center, Room, Aisle, and Rack fields are automatically assigned in OMPC. The servers remain unassigned, if any of the values are missing in the hierarchy.
Managing groups OpenManage Power Center enables you to create groups for organizing devices, so that you can manage them more efficiently. The groups can be of the following types: ● ● ● ● ● Datacenter Room Aisle Rack Custom In the left pane, click Devices > Managed Groups.
● Select the space capacity from the Space Capacity (U) drop-down list. ● Enter the power capacity in the Power Capacity (W) text box. The power capacity is determined by the power distribution to the rack. ● (Optional) Select the Use PDU Power Consumption check box. By default, this check box is cleared. 5. Enter a description for the group in the Description text box. 6. Select the Replicate Group Count option if you want to replicate a device.
● Rearrange devices within rack slots ● Remove devices from rack slots ● Edit devices In the Associated Devices tab you can manage devices such as PDUs that are not added to a rack slot, but are associated with the rack, in the following ways: ● Add an associated device to the rack ● Edit an associated device that has already been added to the rack ● Remove an associated device from the rack Adding a device to a rack slot 1. In the left pane, click Devices > Managed Groups. 2.
5. From the New Slot drop-down list next to the devices you want rearrange, select the slots into which you want to move the devices. NOTE: You can add devices with size up to 42U. 6. Click Finish to return to the Manage Rack screen and review your changes. Removing a rack-associated device 1. In the left pane, click Devices > Managed Groups. 2. From the list of devices select a rack device. 3. In the task menu, click Manage Rack > Associated Devices. 4.
3. In the task menu, click Delete. The Delete Group window is displayed with the details of the managed group that you want to delete. 4. Click Confirm to proceed with the deletion. Emergency Power Reduction When there is an emergency situation — for example, a power failure and your devices are running on UPS, you can initiate Emergency Power Reduction to reduce the power consumption of your managed devices.
8 Virtual machines OMPC monitors the devices, manages the power consumption, and aggregates the observations in the form of a report. However, only physical devices such as server, chassis, UPS, or PDU are monitored. Currently, the power consumption of virtual machines is not monitored. You can discover hypervisors, enumerate virtual machines on the hypervisor, manage power tasks, evaluate, and generate power consumption reports.
● Select the Hypervisor host check box, and select the hypervisor type from the drop-down list. The available options are: ○ VMware ESXi ○ Microsoft Hyper-V NOTE: You can select both the options. ● Select the Status check box, and select the status of the virtual machine from the drop-down list. The available options are: ○ ○ ○ ○ Online Offline Suspended Unknown NOTE: You can select multiple statuses. 6. Click Save and Run to save the filter. You can use the saved filters at a later time.
The current VM group is displayed as Current Entity. 3. The available VM groups to which you can move is listed as Move to. Choose the VM group to which you want to move. 4. Click Save. The VM group is moved to the selected group. Viewing a virtual machine power history graph OpenManage Power Center provides a visual representation of the power history of a virtual machine or a group of virtual machines. 1.
9 Power Monitoring Power Center enables the monitoring of current or historical power-related metrics (for example, power consumption or cost). This can help you understand the power status in the data center and plan for additional power infrastructure, cooling, and facility needs. You can monitor power at different device and/or group levels. You can configure power monitoring settings to meet your monitoring needs, and you can print the power status graph.
Viewing power details In the left pane, click Devices > All Devices or Devices > Managed Groups. Click the icon for a device or group, then refer to the power detail section of the screen. While OpenManage Power Center does provide power information for PDU and other devices and groups, Power Center does not provide power details for UPS devices. For devices and groups (excluding PDU and UPS), by default, the Power graph displays the power details for the previous hour.
Power details for racks For racks, you can click Devices > Managed Group > Details to display PDU power consumption for all rack PDUs. You can also click Devices > Managed Group > Policies to change a power policy. You can view the following power details of PDU devices. For more information on supported PDU devices, see System Requirements. ● PDU device information, including PDU name, model, and IP address.
4. Click View History next to Power Alert Thresholds. The Power History — window is displayed. 5. Select the time period and attributes displayed: a. To select the time period represented in the graph, click the buttons along the top of the graph. b.
10 Temperature Monitoring OpenManage Power Center enables monitoring of the current and historical server inlet temperature of the data centers in Power Center. This can help you understand the temperature status and identify hot spots in the data center. You can monitor the temperature status at different device/group levels. You can configure the temperature monitoring settings to meet your monitoring needs, and you can print the temperature status graph.
Table 5. Time Windows and Intervals (continued) Time Window Description Interval 1Y 1 year 2 weeks NOTE: This table lists the interval when the sampling interval is at the default value (1 minute). Changing the sample interval results in interval changes for the 15Min and 1H time windows. If you change the sampling interval to 3 minutes, the interval of the 15Min time window is 3 minutes.
● Minimum ● Maximum ● Average NOTE: To view specific numbers related to each attribute displayed along any portion of the graph, move the pointer over the graph. 6. To move along the data stream over time, click the navigation arrows below the graph. Monitoring the Temperature of the Chassis/Blade Server You can monitor the inlet temperature at the blade server level. You can also monitor the inlet temperature at the chassis level, including average, maximum, and minimum details.
11 Policies A power policy is a set of configurations to manage the power cap for a device or group. A policy is useful for power management in different situations. For example, you can create a policy to: ● Power Cap — Make sure that power consumption does not exceed the capacity of the circuit. ● Control Power Usage — Schedule power usage according to the workload of the device or group.
● Headroom — The difference between rack power capacity (specified by the user when the rack is added to OpenManage Power Center system) and rack power consumption (determined by the actual power consumption by PDUs added or associated with the rack). ● Demand — Amount of power a device requests to accommodate its workload. ● Estimated maximum power (Estimated max power) — The maximum power consumption allocation estimated for a device.
The power capability status of the devices is changed in the Devices page. The policy of the devices is editable. You can access it from the Policies page. Upgrading Device Power Policy Capability The power policy capability of some devices can be upgraded to include capping of power consumption—for example, PowerEdge M620. These devices show Monitor and Upgradable.
NOTE: The Power Cap Priorities window is accessible only when you select a device group. 11. Click Next to continue, click Back to return to the previous screen, or click Cancel to discontinue the task. 12. In the Power Policy Schedule window, set the monitoring schedule for the policy.
Table 6. Policy Modes (continued) NA NA Disabled The policy is created but not available for use. Enabling or disabling a policy 1. In the left pane, click Policies. The Policies screen is displayed. 2. In the list of policies, select the check box next to the policy or policies that you want to enable or disable. 3. In the task menu, click Enable or Disable. NOTE: The Enable and/or Disable menu options are available only when you select a policy. Viewing policies in the power details graph 1.
The Policies screen is displayed. 2. In the task menu, click Filter. The Policy Filter window is displayed. NOTE: The Policy Filter wizard is displayed only if you have at least one policy. 3. Select an existing filter from the Select Filter drop-down list and run it or proceed to step 4. 4. Under Quick View, select the Policy Type check box and then select the Static, Dynamic, or Temperature option. 5.
12 Analysis This chapter provides information about various graphs and helps in analyzing the artifacts derived from the observation. The Analysis feature enables you to view a graphical representation of the server characteristics, power or thermal characteristics, and also the underutilized servers. You can export the report in XML or CSV format. The graphs are useful in analyzing the power and thermal issues, to measure the server characteristics and utilize them efficiently.
3. Set the power range distribution value by typing the value in Set Y-axis Power Range Granularity text box and click Apply. The graph with the minimum and the maximum power distribution of the server models is displayed. Viewing active idle power distribution graph OMPC enables you to view the details about the distribution of idle power that is the lowest power observed for a specific time duration. 1. In the left pane, click Analysis > Server Characteristics. 2.
2. Enter a value in Power Utilization (X) text box and Percentile Utilization (Y) text box. NOTE: The range for Power Utilization is 0–20. By default, the value is set to 15. NOTE: The range for Percentile Utilization is 80–100. By default, the value is set to 95. 3. Click Save. Power Analysis OMPC helps you in monitoring and managing power in a data center. The observed monitoring data is helpful in planning capacity expansion, placement suggestions. In the left pane, click Analysis > Power Analysis.
8. In the Rack Placement tab, information about the availability of power and space before and after allocation is displayed. You can set the weightage of the racks by typing the required value in Weightage column of the Set the rack placement priority section and click Next. 9. The placement suggestions are provided in the Rack Placement Result section. Analyze the result and click Next. NOTE: Click Add Another Model to repeat the same procedure with a different server model. 10.
2. In the Hot Spot Room section, you can view the rooms that are the hottest in the data center. Click on any room that is listed. Room : Device(s) Under Hot Spot Room window is displayed. The details of the devices are displayed. 3. Click Close. Viewing an over cooled room 1. In the left pane, click Analysis and then click Cooling Analysis. The Data center Cooling Analysis page is displayed. 2. In the Over Cooled Rooms section, you can view the rooms that are the coolest in the data center.
13 Managing reports This chapter provides information on periodically generating reports for inventory and monitoring and managing the reports. Pre-defined templates are provided to help you generate the reports. By default, the reports are generated in HTML format. You can download the reports in XML or CSV format. In the left pane, click Reports. The Reports screen is displayed.
● Thermal Event Policy — The thermal event policy report displays the thermal event based policy settings and other relevant details. ● VM Power Hoarders — The VM Power Hoarders report displays the details of virtual machines that consume more power. ● VM Power Frugal — The VM Power Frugal report displays the details of the virtual machines that consume the least power. ● VM General Inventory— The VM General Inventory report displays the inventory details of the virtual machines.
● VM General Inventory The New Report wizard is displayed. 3. Enter a name for the report in the Name text box. 4. Under Duration, select one of the following options ● Last One — Select one of the following options from the drop-down list: ○ Hour(s) ○ Day(s) ○ Week(s) ○ Month(s) ● Last — Enter the number of days in the past for which you want to create the report. ● Date Range — Enter the start and end dates of the range for which you want to create the report. 5.
Editing reports 1. In the left pane, click Reports. 2. Select the check box next to the report that you want to edit. 3. In the task menu, click Edit. The Edit Report wizard is displayed. 4. Make the required changes. 5. Click Finish to save the changes or click Cancel to return to the Reports screen without saving the changes. Deleting reports 1. In the left pane, click Reports. 2. Select the check box next to the report that you want to delete.
14 Event Management This chapter provides information on event types, severity levels, supported UPS/PDU events, and how to manage Power Center events. You can receive events indicating an abnormal power/temperature situation in the data center. Power Center detects: ● Pre-defined events ● Custom events Power Center uses port 6553 to listen for internal events. If another application is configured to use port 6553, you must change it to reserve port 6533 for Power Center.
Table 8. Power Center events and severity levels Type Description Severity Level Blades Change In Chassis Some blades in a chassis have changed; you must manually rediscover the chassis. Power Center detects chassis changes once every 15 minutes Informative Cannot Register for Events The device cannot register device events to the Power Center server automatically.
Table 8. Power Center events and severity levels (continued) Type Description Severity Level PDU Low Load The PDU power is lower than the low load threshold. Warning PDU Outlet High Load The PDU outlet power is greater than the high load threshold. Warning PDU Outlet Low Load The PDU outlet power is lower than the low load threshold. Warning PDU Outlet Off The PDU outlet is Off. Informative PDU Outlet On The PDU outlet is On. Informative PDU Outlet Overload The PDU outlet is overloaded.
Table 8. Power Center events and severity levels (continued) Type Description Severity Level UPS Overload Events related to output power load limits and exceeded thresholds in the UPS. Critical UPS Shutdown The UPS has shutdown. Informative UPS Temperature Threshold A UPS temperature threshold was exceeded. Critical Custom events Custom events that you have set up are automatically triggered when the custom condition threshold is reached. Table 9.
Application log events The application log contains information about informational or unexpected events, or internal errors that occur in OpenManage Power Center. Table 10. Application log events Type Severity Functional area Description Internal Error Warning Service Power Center internal error. Duplicated Managed Devices Warning Discovery Duplicated device identified. Group Structure Change Policy Warning Policy A group structure has affected a policy.
Table 11. PDU and UPS events (continued) Emerson UPS UPS Low Battery Dell PDU PDU Low Load, PDU High Load, PDU Overload, PDU Outlet Low Load*, PDU Outlet High Load*, PDU Outlet Overload*, PDU Outlet On*, PDU Outlet Off* NOTE: Events marked with * are only supported on Dell Managed Rack PDU 6605.
The Events screen with the list of events is displayed. NOTE: By default, the protocol error events are hidden. To view these events, click Settings > Database. In the Events Logs Settings section, uncheck the Ignore Protocol Operation Events(s) option. Sorting events 1. In the left pane, click Events. By default, events are listed by Date in descending order (from most recent to older). 2.
Filtering events The Events Filter feature helps you to view events of specific types, severity levels, Acknowledged By user name, and/or events that occur within a specific time period. 1. In the left pane, click Events. 2. In the task menu, click Filter. The Events Filter window is displayed. 3. Do one or more of the following: ● Select an Entity Type from the drop-down list.
1. Open the iDRAC management console of the M610, and go to the page related to SNMP trap settings. 2. Click Send next to the Power Center server address to send a test event. 3. Open the Power Center management console, and click Event Logs in the left pane. The informative event IPMI Test appears on the Event Logs page. NOTE: For more information on steps 1 and 2, see the IPMI device documentation.
15 Security Power Center is designed to ensure data confidentiality, data integrity, and the security of user authentication. Power Center not only provides authentication and access control to user accounts (see Access Control), but also protects all of the communication channels to the Power Center server and the stored sensitive data (for example, passwords) on the Power Center server.
● Dell\OpenManagePowerCenter\external\apache-tomcat\conf\tomcat-users.xml ● Dell\OpenManagePowerCenter\external\apache-tomcat\conf\web.xml ● Dell\OpenManagePowerCenter\keystore.ssl ● Dell\OpenManagePowerCenter\pgdata\pg_hba.conf ● Dell\OpenManagePowerCenter\pgdata\postgresql.conf 4. Delete all content under Dell\OpenManagePowerCenter\external\apache-tomcat\work. 5. Update the Properties of the Power Center services to use the normal user account to log into the service.
The event logs are kept in the log file. You can find the log file(s) in: \OpenManagePowerCenter\logs\Audit.log.x. Where x is the incremental number, if applicable (shown below.) The total size of all audit log files is limited to 20 MB. Power Center keeps up to three audit log files of approximately 6.67 MB each.
16 Configuring settings You configure the OpenManage Power Center settings in the Settings screen. The Settings screen comprises the following tabs: ● General — Configure the timeout for console and device communication. ● Monitoring — Configure the power/thermal units and energy consumption parameters. ● Alerts — Configure alerts for SNMP traps, enable or disable sending alerts through emails, configure email recipients, and event severity-level. ● SMTP — Configure SMTP parameters for sending alert emails.
2. In the Protocols Timeout section, enter the time in seconds for the specified communication protocol (IPMI, SNMP, WSMAN, HTTPS, or SSH). OpenManage Power Center considers the device not reachable if it cannot get any response from the device within the timeout period. 3. Click Save to apply your settings, Reset to revert to the previously saved settings. The new settings take effect the next time when Power Center communicates with the device.
Configuring the power and temperature monitoring units 1. Under Monitoring > Power Units settings, select the unit of measurement in which the power consumption must be displayed. The available options are: ● Watts ● BTU/hr 2. Under Temperature Units, select one of the following options in which the temperature monitoring must be displayed. The available options are: ● Celsius ● Fahrenheit 3. Click Save to apply the settings, or click Reset to revert to the previously saved settings.
● Events Logs Settings — Enter the maximum size for the OpenManage Power Center event log stored in the database, in the Maximum log size text box. The default is 100000 entries. After reaching the specified log size, a new event log is created. Setting or editing the database policy 1. In the left pane, click Settings > Database. 2. From the Data compression drop-down list, select the number of days (1-14) for which you want to keep the noncompressed data (the default is 7 days). 3.
Directory NOTE: The Directory settings screen is available only in the Linux environment. On the Directory settings screen, you can configure LDAP settings to manage user authentication and certificate validation on systems running Linux, where OpenManage Power Center is installed. The following table lists the options available on this screen. Table 14. Directory settings options Option Description Enable LDAP User Authentication Select the check box to enable the LDAP user authentication.
Table 14. Directory settings options (continued) Option Description ● Directory Service CA Certificate Information Upload Directory Service CA Certificate Click Choose File to navigate to the location on the system where the CA certificate is located, select the file and then click Open to upload the file. The name of file you selected is displayed. Directory Service DA Certificate Information Displays information about the CA certificate that is in effect.
○ Upload Directory Service CA Certificate (optional unless Certificate Validation is enabled) — Click Browse and navigate to the CA certificate you want to upload, then click Open to upload the new certificate. ○ Directory Service CA Certificate Information — Displays information about the CA certificate that is in effect. 4. Click Save to save your settings, or click Reset to revert to the previously saved settings. Viewing directory settings In the left pane, click Settings > Directory.
1. In the left pane, click Settings > Alerts. 2. Select the Enable SNMP Traps check box. 3. Enter the following information: ● The IP address or hostname (Destination IP/Host) of the destination device to which events are sent. The maximum length is 255 characters. ● The port number (Port) of the destination device. You can enter any available port between 1 - 65535 (default is 162). ● The community name (Community Name) that describes the community; for example, Public.
The licenses are of three types: ● Trial — These licenses are valid for a limited duration only. ● Perpetual — These licenses do not expire, but they can be used only for the number of nodes mentioned while obtaining the license. ● Site — These licenses do not expire, can be used for unlimited nodes. NOTE: Only users with the Manage License privilege can import the license. On the Licensing settings screen, you can: ● View the summary and details of the licenses obtained.
17 Logs The Logs feature displays information about unexpected or informational events, or internal errors that occur in OpenManage Power Center. The latest application log is displayed on the top of the list. A log can have a maximum of 1,00,000 entries. In the left pane, click Logs. The Application Logs screen is displayed.
18 Troubleshooting This chapter lists some of the known issues you may encounter when working with Power Center. Why am I being required to log in more than once by Power Center? Possible Cause: This occurs when one of the following elements of Kerberos SSO is not correctly configured: the Power Center server, the web browser, or the AD domain controller configuration. Resolution: Correctly configure your Power Center server and web browser for Kerberos SSO.
Why can’t Power Center receive events sent from devices? Possible Cause: Power Center is not the destination host of the events sent from devices. Resolution: Make sure the Power Center server’s IP address is registered on the device as the destination for events. Possible Cause: There is a network connection problem. Resolution: Make sure the device network and the Power Center server are connected and packets can be routed. Possible Cause: Essential services are not started.
Why I can’t open power center login page when I access it through Firefox 31? Possible Cause: During the installation of power center, a self-signed certificate is created for power center. If end user has replaced this self-signed certificate with a certificate signed by a well-known CA(Firefox recognize this CA), then you do not encounter this issue. Mozilla has improved its certificate verification process. For more information, visit www.wiki.mozilla.org/SecurityEngineering/Certificate_Verification.
Resolution: The chassis is added to the group at the back-end, but the GUI times out before the chassis responds to OpenManager Power Center. In the compare report, why is the average power value of a device different when the service is stopped for a few hours? Possible Cause: There may be an inconsistency in the logic for All Devices and Managed Groups. Resolution: You can select the device from the Managed Groups where the power value calculation is more accurate.
I am not able to manage the servers discovered by OMPC through the Redfish protocol. Events are also not logged. How do I troubleshoot and resolve the issue? In OMPC 4.0, you may not be able to use certain features when you discover the servers through Redfish protocol with the lockdown feature of iDRAC enabled. The below matrix lists the restrictions: Table 16.
A Upgrade failure recovery on Microsoft Windows operating system Check OMPC status If the installer process is stopped or server is switched off during upgrade, the upgrade fails. Follow the steps to troubleshoot the upgrade failure scenario: 1. Run wmic product where name='Dell OpenManage Power Center' get version command on the windows command line interface to get the current version OMPC. 2. If the OMPC old version is displayed, for example 3.1.0.
b. Stop all OMPC services if they exist. c. Delete all OMPC services if they exist with below command: i. Sc.exe delete "DatacenterManager" ii. Sc.exe delete "DatacenterManagerSnmp" iii. Sc.exe delete "DatacenterManagerServer" iv. Sc.exe delete "Dell OpenManage Power Center Database Server" 2. Run the command in windows command line to reinstall old OMPC: (app.exe or app64.exe depending on 32–bit or 64–bit OS ): "[LocalAppData]\ompc\ompcold\App.exe" /V"/qb! INSTALLDIR=\"[InstDir]\" PGSQLDATADIR=\"[DataDir
B Upgrade failure recovery on Linux operating system Use install.sh command in the new OMPC version package to do upgrade or install OMPC. The install.sh command detects the version of OMPC. if there is an old version installed, upgrade process is initialized. If not, then a new version is installed. NOTE: If you use rpm -U during the OpenManage Power Center installation or upgrade, many warning messages will get displayed.
a. [PGSQLDRV]= postgresql-9.3-1102.jdbc4.jar if target version is above or equals to 3.1; b. [PGSQLDRV]= postgresql-8.3-603.jdbc4.jar if target version below 3.1; You can get the current database version by the DB_VERSION item in [InstDir]/dbinfor.tmp. Check the availability of /etc/ompc/upgradeok: If it exists, it means upgrade completed. If not, new OMPC installed but upgrading yet to be completed. Rollback to previous OMPC version 1. Launch roll back script: /etc/ompc/backup/ompcrollback.sh. 2.