
Users Guide
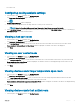

Table Of Contents
- Dell EMC OpenManage Power Center 4.0 User’s Guide
- Overview
- Getting started
- Using OpenManage Power Center
- Preinstallation requirement for OpenManage Power Center
- Using Power Center on Microsoft Windows operating systems
- Installing OpenManage Power Center on Microsoft Windows Server
- Installed directories in Windows
- OpenManage Power Center services on Microsoft Windows operating systems
- Upgrading Power Center on Microsoft Windows operating systems
- Uninstalling OpenManage Power Center on Microsoft Windows operating system
- Launching OpenManage Power Center on Microsoft Windows operating systems
- Configuring Enhanced Security Configuration for Internet Explorer
- Using OpenManage Power Center on Linux operating systems
- Using OpenManage Power Center through Command Line Interface
- Command Line Interface error handling
- Command Line Interface commands
- help
- add_profile
- update_profile
- add_device
- update_device
- rediscover_device
- find_device
- remove_profile
- delete_device
- add_group
- delete_group
- update_group
- add_device_to_group
- remove_device_from_group
- move_device
- move_group
- add_group_to_group
- List commands
- list_device_props
- list_devices
- list_group_props
- list_groups
- list_report_groups
- list_reports
- run_report
- discover_device
- backup_database
- restore_database
- add_ssh_server_key
- remove_ssh_server_key
- list_ssh_server_key
- Command line interface error codes
- Access control
- Task management
- Device Management
- Virtual machines
- Power Monitoring
- Temperature Monitoring
- Policies
- Analysis
- Managing reports
- Event Management
- Security
- Configuring settings
- Logs
- Troubleshooting
- Why am I being required to log in more than once by Power Center?
- Why can’t I access the Power Center management console from a Web browser, even though the Power Center server is running normally?
- Why was I automatically logged out of Power Center?
- Why did my connection to iDRAC6 devices (PowerEdge Servers) fail, when the network connection status is Connected?
- Why can’t Power Center receive events sent from devices?
- Why are previously-existing power policies (including EPR) still effective on devices when Power Center is corrupted or has been uninstalled?
- Why do I see the PostgreSQL error log "FATAL: terminating connection due to administrator command" in the Windows event log?
- Why I can’t open power center login page when I access it through Firefox 31?
- Why I encounter an error, “An internal error occurred. Contact the technical support for help: subordinate error code: 0x8f0c1301”, the Home page when OpenManage Power Center server is installed on SUSE Linux Enterprise Server 11 SP2?
- Why do I encounter a network exception while adding a LDAP user?
- Why do I encounter a network exception while adding a chassis to a group?
- In the compare report, why is the average power value of a device different when the service is stopped for a few hours?
- Why is the “policy return to normal” event not displayed when the only device in the Chassis Management Controller (CMC) is deleted?
- After discovering the devices, incorrect device information is displayed? Why is this happening?
- I am not able to view the power headroom graph on the home screen. How do I troubleshoot?
- I am not able to manage the servers discovered by OMPC through the Redfish protocol. Events are also not logged. How do I troubleshoot and resolve the issue?
- I discovered a server through the Redfish protocol. When I tried to manage the server, the events are not logged in the event list. What do I do now?
- Upgrade failure recovery on Microsoft Windows operating system
- Upgrade failure recovery on Linux operating system

• Hot outlier room
Conguring cooling analysis settings
1 In the left pane, click Analysis and then click Cooling Analysis.
The Data center Cooling Analysis page is displayed.
2 Click .
Cooling Analysis Settings window is displayed.
3 Select the threshold temperature from the drop-down list to classify a room as Hot Room.
NOTE: Values for Over Cooled Rooms and Large Temperature Span Rooms are present by default.
4 In the Hot Outlier Devices section, type a value in the text box to classify a device as a Hot Outlier Device. A device is classied as a
Hot Outlier Device if it exceeds the dened value.
Viewing a hot spot room
1 In the left pane, click Analysis and then click Cooling Analysis.
The Datacenter Cooling Analysis page is displayed.
2 In the Hot Spot Room section, you can view the rooms that are the hottest in the data center. Click on any room that is listed.
Room <number>: Device(s) Under Hot Spot Room window is displayed. The details of the devices are displayed.
3 Click Close.
Viewing an over cooled room
1 In the left pane, click Analysis and then click Cooling Analysis.
The Data center Cooling Analysis page is displayed.
2 In the Over Cooled Rooms section, you can view the rooms that are the coolest in the data center. Click on any room that is listed.
Room <number>: Over Cooled Room window is displayed. The details of the devices are displayed along with the reason for the
scenario along with the resolution.
3 Click Close.
Viewing devices under large temperature span room
1 In the left pane, click Analysis and then click Cooling Analysis.
The Data center Cooling Analysis page is displayed.
2 In the Large Temperature Span Rooms section, you can view the rooms with a large temperature dierence between the inlet
temperature and over cooling threshold value. Click on any room that is listed.
Room <number>: Devices Under Large Temperature Span Room window is displayed. The details of the devices are displayed along
with the reason for the scenario along with the resolution.
3 Click Close.
Viewing devices under hot outlier room
1 In the left pane, click Analysis and then click Cooling Analysis.
Analysis
95