
Users Guide
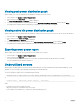
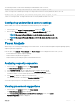
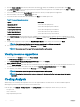
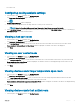

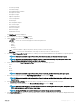
Table Of Contents
- Dell EMC OpenManage Power Center 4.0 User’s Guide
- Overview
- Getting started
- Using OpenManage Power Center
- Preinstallation requirement for OpenManage Power Center
- Using Power Center on Microsoft Windows operating systems
- Installing OpenManage Power Center on Microsoft Windows Server
- Installed directories in Windows
- OpenManage Power Center services on Microsoft Windows operating systems
- Upgrading Power Center on Microsoft Windows operating systems
- Uninstalling OpenManage Power Center on Microsoft Windows operating system
- Launching OpenManage Power Center on Microsoft Windows operating systems
- Configuring Enhanced Security Configuration for Internet Explorer
- Using OpenManage Power Center on Linux operating systems
- Using OpenManage Power Center through Command Line Interface
- Command Line Interface error handling
- Command Line Interface commands
- help
- add_profile
- update_profile
- add_device
- update_device
- rediscover_device
- find_device
- remove_profile
- delete_device
- add_group
- delete_group
- update_group
- add_device_to_group
- remove_device_from_group
- move_device
- move_group
- add_group_to_group
- List commands
- list_device_props
- list_devices
- list_group_props
- list_groups
- list_report_groups
- list_reports
- run_report
- discover_device
- backup_database
- restore_database
- add_ssh_server_key
- remove_ssh_server_key
- list_ssh_server_key
- Command line interface error codes
- Access control
- Task management
- Device Management
- Virtual machines
- Power Monitoring
- Temperature Monitoring
- Policies
- Analysis
- Managing reports
- Event Management
- Security
- Configuring settings
- Logs
- Troubleshooting
- Why am I being required to log in more than once by Power Center?
- Why can’t I access the Power Center management console from a Web browser, even though the Power Center server is running normally?
- Why was I automatically logged out of Power Center?
- Why did my connection to iDRAC6 devices (PowerEdge Servers) fail, when the network connection status is Connected?
- Why can’t Power Center receive events sent from devices?
- Why are previously-existing power policies (including EPR) still effective on devices when Power Center is corrupted or has been uninstalled?
- Why do I see the PostgreSQL error log "FATAL: terminating connection due to administrator command" in the Windows event log?
- Why I can’t open power center login page when I access it through Firefox 31?
- Why I encounter an error, “An internal error occurred. Contact the technical support for help: subordinate error code: 0x8f0c1301”, the Home page when OpenManage Power Center server is installed on SUSE Linux Enterprise Server 11 SP2?
- Why do I encounter a network exception while adding a LDAP user?
- Why do I encounter a network exception while adding a chassis to a group?
- In the compare report, why is the average power value of a device different when the service is stopped for a few hours?
- Why is the “policy return to normal” event not displayed when the only device in the Chassis Management Controller (CMC) is deleted?
- After discovering the devices, incorrect device information is displayed? Why is this happening?
- I am not able to view the power headroom graph on the home screen. How do I troubleshoot?
- I am not able to manage the servers discovered by OMPC through the Redfish protocol. Events are also not logged. How do I troubleshoot and resolve the issue?
- I discovered a server through the Redfish protocol. When I tried to manage the server, the events are not logged in the event list. What do I do now?
- Upgrade failure recovery on Microsoft Windows operating system
- Upgrade failure recovery on Linux operating system

3 From the Group Selection tab, select the data centers by clicking + to analyze the availability of power and space. Click Next.
4 In the Placement Type tab, select the type of placement required from the drop-down list. The available options are Auto and Manual.
By default, Auto option is selected.
5 Select the server model from the Server Model drop-down list for which you require placement suggestions.
6 Enter the number of servers in the Server Count text eld.
7 Select the criteria in which the racks are selected and click Next. The available options are:
Table 7. Placement Suggestions options
Option Description
Equal rack priority Select racks with equal priority
Highest space headroom Select racks with higher space headroom
Highest power headroom Select racks with higher power headroom
Lowest space headroom Select racks with lowest space headroom
Lowest power headroom Select racks with lowest power headroom
8 In the Rack Placement tab, information about the availability of power and space before and after allocation is displayed. You can set
the weightage of the racks by typing the required value in
Weightage column of the Set the rack placement priority section and click
Next.
9 The placement suggestions are provided in the Rack Placement Result section. Analyze the result and click Next.
NOTE: Click Add Another Model to repeat the same procedure with a dierent server model.
10 The summary of the analysis is displayed in the Summary screen. Click Finish.
NOTE
: You can also export the report to the required location on the system.
Viewing resource suggestions
1 In the left pane, click Analysis and then click Power Analysis.
The Power & Space Analysis page is displayed.
2 In the Power and Space Gains from Underutilized Server(s) section, click Launch.
Power and Space Savings window is displayed.
3 From the Server Selection tab, details about the underutilized servers are displayed. Select the servers by clicking the check box next
to each server. You can also select all the servers by selecting Consider all underutilized servers option. Click Next.
4 The summary of the analysis is displayed in the Summary screen. Click Finish.
NOTE
: You can also export the report to the required location on the system.
NOTE: The estimated data should be used as a reference for planning as the nal value may change during plan
execution.
Cooling Analysis
OMPC helps you in monitoring the temperature sensors of the supported devices in a data center. The observed data is helpful in
identifying the potential cooling issues of all the rooms in a data center.
In the left pane, click Analysis > Cooling Analysis. The Cooling Analysis screen is displayed. On this screen, you can view:
• Hot spot room
• Over cooled room
• Large temperature span room
94
Analysis