
Users Guide
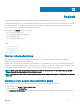
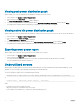
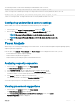

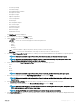
Table Of Contents
- Dell EMC OpenManage Power Center 4.0 User’s Guide
- Overview
- Getting started
- Using OpenManage Power Center
- Preinstallation requirement for OpenManage Power Center
- Using Power Center on Microsoft Windows operating systems
- Installing OpenManage Power Center on Microsoft Windows Server
- Installed directories in Windows
- OpenManage Power Center services on Microsoft Windows operating systems
- Upgrading Power Center on Microsoft Windows operating systems
- Uninstalling OpenManage Power Center on Microsoft Windows operating system
- Launching OpenManage Power Center on Microsoft Windows operating systems
- Configuring Enhanced Security Configuration for Internet Explorer
- Using OpenManage Power Center on Linux operating systems
- Using OpenManage Power Center through Command Line Interface
- Command Line Interface error handling
- Command Line Interface commands
- help
- add_profile
- update_profile
- add_device
- update_device
- rediscover_device
- find_device
- remove_profile
- delete_device
- add_group
- delete_group
- update_group
- add_device_to_group
- remove_device_from_group
- move_device
- move_group
- add_group_to_group
- List commands
- list_device_props
- list_devices
- list_group_props
- list_groups
- list_report_groups
- list_reports
- run_report
- discover_device
- backup_database
- restore_database
- add_ssh_server_key
- remove_ssh_server_key
- list_ssh_server_key
- Command line interface error codes
- Access control
- Task management
- Device Management
- Virtual machines
- Power Monitoring
- Temperature Monitoring
- Policies
- Analysis
- Managing reports
- Event Management
- Security
- Configuring settings
- Logs
- Troubleshooting
- Why am I being required to log in more than once by Power Center?
- Why can’t I access the Power Center management console from a Web browser, even though the Power Center server is running normally?
- Why was I automatically logged out of Power Center?
- Why did my connection to iDRAC6 devices (PowerEdge Servers) fail, when the network connection status is Connected?
- Why can’t Power Center receive events sent from devices?
- Why are previously-existing power policies (including EPR) still effective on devices when Power Center is corrupted or has been uninstalled?
- Why do I see the PostgreSQL error log "FATAL: terminating connection due to administrator command" in the Windows event log?
- Why I can’t open power center login page when I access it through Firefox 31?
- Why I encounter an error, “An internal error occurred. Contact the technical support for help: subordinate error code: 0x8f0c1301”, the Home page when OpenManage Power Center server is installed on SUSE Linux Enterprise Server 11 SP2?
- Why do I encounter a network exception while adding a LDAP user?
- Why do I encounter a network exception while adding a chassis to a group?
- In the compare report, why is the average power value of a device different when the service is stopped for a few hours?
- Why is the “policy return to normal” event not displayed when the only device in the Chassis Management Controller (CMC) is deleted?
- After discovering the devices, incorrect device information is displayed? Why is this happening?
- I am not able to view the power headroom graph on the home screen. How do I troubleshoot?
- I am not able to manage the servers discovered by OMPC through the Redfish protocol. Events are also not logged. How do I troubleshoot and resolve the issue?
- I discovered a server through the Redfish protocol. When I tried to manage the server, the events are not logged in the event list. What do I do now?
- Upgrade failure recovery on Microsoft Windows operating system
- Upgrade failure recovery on Linux operating system

Viewing peak power distribution graph
OMPC enables you to view the details about the distribution of peak power for the servers.
1 In the left pane, click Analysis > Server Characteristics.
2 In the task menu, click Peak Power.
The Peak Power Distribution — <Server> graph is displayed.
3 Set the power range distribution value by typing the value in Set Y-axis Power Range Granularity text box and click Apply.
The graph with the minimum and the maximum power distribution of the server models is displayed.
Viewing active idle power distribution graph
OMPC enables you to view the details about the distribution of idle power that is the lowest power observed for a specic time duration.
1 In the left pane, click Analysis > Server Characteristics.
2 In the task menu, click Active Idle Power.
The Active Idle Power — <Server> graph is displayed.
3 Set the distribution range value by typing the value in Set Y-axis Power Range Granularity text box and click Apply.
The graph with the minimum and the maximum active idle power distribution of the server models is displayed.
Exporting server power report
OMPC enables you to export the server power report to a local drive on your system.
1 In the left pane, click Analysis > Server Characteristics.
2 In the task menu, click Export All.
The report downloads to your local system in *.CSV format. The lename includes the date and time. For example,
ServerPowerCharacteristics-20150513–124005.csv
Underutilized servers
OMPC helps you in identifying the servers that are not utilized eciently. The observed data is important in understanding the overall
utilization of servers in a data center and helps in distributing the workload eciently.
The server utilization in a data center is calculated using the formula,
• Maximum value of CUPS indices for CPU, Memory bandwidth and I/O bandwidth, if available
or,
• (Current Power – Idle Power)/(Power Capacity – Idle Power)
where,
• Current power is the power used by the server
• Idle power is the power consumption when server is idle
• Power capacity is the maximum of (2 * idle power, observed maximum power).
92
Analysis