
Users Guide
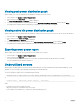

Table Of Contents
- Dell EMC OpenManage Power Center 4.0 User’s Guide
- Overview
- Getting started
- Using OpenManage Power Center
- Preinstallation requirement for OpenManage Power Center
- Using Power Center on Microsoft Windows operating systems
- Installing OpenManage Power Center on Microsoft Windows Server
- Installed directories in Windows
- OpenManage Power Center services on Microsoft Windows operating systems
- Upgrading Power Center on Microsoft Windows operating systems
- Uninstalling OpenManage Power Center on Microsoft Windows operating system
- Launching OpenManage Power Center on Microsoft Windows operating systems
- Configuring Enhanced Security Configuration for Internet Explorer
- Using OpenManage Power Center on Linux operating systems
- Using OpenManage Power Center through Command Line Interface
- Command Line Interface error handling
- Command Line Interface commands
- help
- add_profile
- update_profile
- add_device
- update_device
- rediscover_device
- find_device
- remove_profile
- delete_device
- add_group
- delete_group
- update_group
- add_device_to_group
- remove_device_from_group
- move_device
- move_group
- add_group_to_group
- List commands
- list_device_props
- list_devices
- list_group_props
- list_groups
- list_report_groups
- list_reports
- run_report
- discover_device
- backup_database
- restore_database
- add_ssh_server_key
- remove_ssh_server_key
- list_ssh_server_key
- Command line interface error codes
- Access control
- Task management
- Device Management
- Virtual machines
- Power Monitoring
- Temperature Monitoring
- Policies
- Analysis
- Managing reports
- Event Management
- Security
- Configuring settings
- Logs
- Troubleshooting
- Why am I being required to log in more than once by Power Center?
- Why can’t I access the Power Center management console from a Web browser, even though the Power Center server is running normally?
- Why was I automatically logged out of Power Center?
- Why did my connection to iDRAC6 devices (PowerEdge Servers) fail, when the network connection status is Connected?
- Why can’t Power Center receive events sent from devices?
- Why are previously-existing power policies (including EPR) still effective on devices when Power Center is corrupted or has been uninstalled?
- Why do I see the PostgreSQL error log "FATAL: terminating connection due to administrator command" in the Windows event log?
- Why I can’t open power center login page when I access it through Firefox 31?
- Why I encounter an error, “An internal error occurred. Contact the technical support for help: subordinate error code: 0x8f0c1301”, the Home page when OpenManage Power Center server is installed on SUSE Linux Enterprise Server 11 SP2?
- Why do I encounter a network exception while adding a LDAP user?
- Why do I encounter a network exception while adding a chassis to a group?
- In the compare report, why is the average power value of a device different when the service is stopped for a few hours?
- Why is the “policy return to normal” event not displayed when the only device in the Chassis Management Controller (CMC) is deleted?
- After discovering the devices, incorrect device information is displayed? Why is this happening?
- I am not able to view the power headroom graph on the home screen. How do I troubleshoot?
- I am not able to manage the servers discovered by OMPC through the Redfish protocol. Events are also not logged. How do I troubleshoot and resolve the issue?
- I discovered a server through the Redfish protocol. When I tried to manage the server, the events are not logged in the event list. What do I do now?
- Upgrade failure recovery on Microsoft Windows operating system
- Upgrade failure recovery on Linux operating system

Analysis
This chapter provides information about various graphs and helps in analyzing the artifacts derived from the observation.
The Analysis feature enables you to view a graphical representation of the server characteristics, power or thermal characteristics, and also
the underutilized servers. You can export the report in XML or CSV format. The graphs are useful in analyzing the power and thermal
issues, to measure the server characteristics and utilize them eciently.
In the left pane, click Analysis. On this screen, you can:
• View server power characteristics
• View peak power and idle power distribution
• View underutilized servers
• View power and thermal information
Topics:
• Server characteristics
• Underutilized servers
• Power Analysis
• Cooling Analysis
Server characteristics
Using OMPC you can view the power consumption at a single-server level. The power consumption reading from a single-server
perspective is useful in capacity planning of a data center.
Currently, to view the server power characteristics, the dependency is on the nameplate of the server or an estimated value, which may
vary from the actual value. OMPC collects information about the power consumption of all servers. Using the server power characteristics
feature, OMPC classies and represents the overall power consumption of each device based on the actual usage.
NOTE
: All the servers (Dell and non-Dell) are categorized based on the support provided for the power monitoring capability
feature along with the servers which provide instantaneous power.
NOTE: Chassis or any of the enclosure devices are not considered for the analysis as the number of blades used in the enclosure
may vary.
Viewing server power characteristics graph
OMPC enables you to view the details about the server power consumption from a single server perspective.
1 In the left pane, click Analysis > Server Characteristics.
2 In the task menu, click Graphical View.
The Server Power Characteristics graph is displayed. The graph displays the minimum and the maximum power consumption of all
server models.
12
Analysis 91