
Users Guide

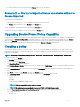
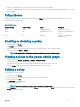
Table Of Contents
- Dell EMC OpenManage Power Center 4.0 User’s Guide
- Overview
- Getting started
- Using OpenManage Power Center
- Preinstallation requirement for OpenManage Power Center
- Using Power Center on Microsoft Windows operating systems
- Installing OpenManage Power Center on Microsoft Windows Server
- Installed directories in Windows
- OpenManage Power Center services on Microsoft Windows operating systems
- Upgrading Power Center on Microsoft Windows operating systems
- Uninstalling OpenManage Power Center on Microsoft Windows operating system
- Launching OpenManage Power Center on Microsoft Windows operating systems
- Configuring Enhanced Security Configuration for Internet Explorer
- Using OpenManage Power Center on Linux operating systems
- Using OpenManage Power Center through Command Line Interface
- Command Line Interface error handling
- Command Line Interface commands
- help
- add_profile
- update_profile
- add_device
- update_device
- rediscover_device
- find_device
- remove_profile
- delete_device
- add_group
- delete_group
- update_group
- add_device_to_group
- remove_device_from_group
- move_device
- move_group
- add_group_to_group
- List commands
- list_device_props
- list_devices
- list_group_props
- list_groups
- list_report_groups
- list_reports
- run_report
- discover_device
- backup_database
- restore_database
- add_ssh_server_key
- remove_ssh_server_key
- list_ssh_server_key
- Command line interface error codes
- Access control
- Task management
- Device Management
- Virtual machines
- Power Monitoring
- Temperature Monitoring
- Policies
- Analysis
- Managing reports
- Event Management
- Security
- Configuring settings
- Logs
- Troubleshooting
- Why am I being required to log in more than once by Power Center?
- Why can’t I access the Power Center management console from a Web browser, even though the Power Center server is running normally?
- Why was I automatically logged out of Power Center?
- Why did my connection to iDRAC6 devices (PowerEdge Servers) fail, when the network connection status is Connected?
- Why can’t Power Center receive events sent from devices?
- Why are previously-existing power policies (including EPR) still effective on devices when Power Center is corrupted or has been uninstalled?
- Why do I see the PostgreSQL error log "FATAL: terminating connection due to administrator command" in the Windows event log?
- Why I can’t open power center login page when I access it through Firefox 31?
- Why I encounter an error, “An internal error occurred. Contact the technical support for help: subordinate error code: 0x8f0c1301”, the Home page when OpenManage Power Center server is installed on SUSE Linux Enterprise Server 11 SP2?
- Why do I encounter a network exception while adding a LDAP user?
- Why do I encounter a network exception while adding a chassis to a group?
- In the compare report, why is the average power value of a device different when the service is stopped for a few hours?
- Why is the “policy return to normal” event not displayed when the only device in the Chassis Management Controller (CMC) is deleted?
- After discovering the devices, incorrect device information is displayed? Why is this happening?
- I am not able to view the power headroom graph on the home screen. How do I troubleshoot?
- I am not able to manage the servers discovered by OMPC through the Redfish protocol. Events are also not logged. How do I troubleshoot and resolve the issue?
- I discovered a server through the Redfish protocol. When I tried to manage the server, the events are not logged in the event list. What do I do now?
- Upgrade failure recovery on Microsoft Windows operating system
- Upgrade failure recovery on Linux operating system

Viewing a temperature history graph
OpenManage Power Center provides a visual representation of the temperature history of your system devices.
1 In the left pane, click Devices > All Devices or Devices > Managed Group.
2 From the list of devices, select a device.
The details of the device are displayed in the Details section.
3 In the Details section, click the Thresholds tab.
Alternately, you can also click Thermal History in the Summary tab.
4 Click View History next to Average Inlet Temperature Alert Thresholds.
The Thermal History — <device> Group window is displayed.
5 Select the time period and attributes displayed:
a To select the time period represented in the graph, click the buttons along the top of the graph.
b To add or delete attributes, select from the listed options; click the option to toggle its addition or removal from the graph:
• Minimum
• Maximum
• Average
NOTE: To view specic numbers related to each attribute displayed along any portion of the graph, move the pointer
over the graph.
6 To move along the data stream over time, click the navigation arrows below the graph.
Monitoring the Temperature of the Chassis/Blade
Server
You can monitor the inlet temperature at the blade server level.
You can also monitor the inlet temperature at the chassis level, including average, maximum, and minimum details.
Applying circuit breaker limits to chassis
OpenManage Power Center enables you to place circuit breaker, or static power cap limits on chassis that support M1000E 4.4 or later and
VRTX 1.35 or later.
1 In the left pane, click Devices > All Devices or Devices > Managed Groups.
2 From the list of devices, select a specic chassis.
The details of the selected chassis are displayed in the <Device> Details > Summary section.
3 Click Edit next to Chassis Circuit Breaker.
The Edit Chassis Circuit Breaker window is displayed.
4 Enter the Chassis Circuit Breaker Cap, Chassis Lower Bound, and Chassis Upper Bound values for the selected chassis.
NOTE
: By default, the lower bound chassis circuit breaker for VRTX 1.35 and earlier versions is '0'. Update the rmware
to the latest version.
5 Click Save to apply your changes, or click Cancel to discard your changes.
Temperature Monitoring
83