
Users Guide
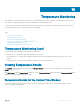
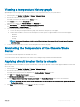

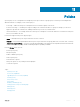
Table Of Contents
- Dell EMC OpenManage Power Center 4.0 User’s Guide
- Overview
- Getting started
- Using OpenManage Power Center
- Preinstallation requirement for OpenManage Power Center
- Using Power Center on Microsoft Windows operating systems
- Installing OpenManage Power Center on Microsoft Windows Server
- Installed directories in Windows
- OpenManage Power Center services on Microsoft Windows operating systems
- Upgrading Power Center on Microsoft Windows operating systems
- Uninstalling OpenManage Power Center on Microsoft Windows operating system
- Launching OpenManage Power Center on Microsoft Windows operating systems
- Configuring Enhanced Security Configuration for Internet Explorer
- Using OpenManage Power Center on Linux operating systems
- Using OpenManage Power Center through Command Line Interface
- Command Line Interface error handling
- Command Line Interface commands
- help
- add_profile
- update_profile
- add_device
- update_device
- rediscover_device
- find_device
- remove_profile
- delete_device
- add_group
- delete_group
- update_group
- add_device_to_group
- remove_device_from_group
- move_device
- move_group
- add_group_to_group
- List commands
- list_device_props
- list_devices
- list_group_props
- list_groups
- list_report_groups
- list_reports
- run_report
- discover_device
- backup_database
- restore_database
- add_ssh_server_key
- remove_ssh_server_key
- list_ssh_server_key
- Command line interface error codes
- Access control
- Task management
- Device Management
- Virtual machines
- Power Monitoring
- Temperature Monitoring
- Policies
- Analysis
- Managing reports
- Event Management
- Security
- Configuring settings
- Logs
- Troubleshooting
- Why am I being required to log in more than once by Power Center?
- Why can’t I access the Power Center management console from a Web browser, even though the Power Center server is running normally?
- Why was I automatically logged out of Power Center?
- Why did my connection to iDRAC6 devices (PowerEdge Servers) fail, when the network connection status is Connected?
- Why can’t Power Center receive events sent from devices?
- Why are previously-existing power policies (including EPR) still effective on devices when Power Center is corrupted or has been uninstalled?
- Why do I see the PostgreSQL error log "FATAL: terminating connection due to administrator command" in the Windows event log?
- Why I can’t open power center login page when I access it through Firefox 31?
- Why I encounter an error, “An internal error occurred. Contact the technical support for help: subordinate error code: 0x8f0c1301”, the Home page when OpenManage Power Center server is installed on SUSE Linux Enterprise Server 11 SP2?
- Why do I encounter a network exception while adding a LDAP user?
- Why do I encounter a network exception while adding a chassis to a group?
- In the compare report, why is the average power value of a device different when the service is stopped for a few hours?
- Why is the “policy return to normal” event not displayed when the only device in the Chassis Management Controller (CMC) is deleted?
- After discovering the devices, incorrect device information is displayed? Why is this happening?
- I am not able to view the power headroom graph on the home screen. How do I troubleshoot?
- I am not able to manage the servers discovered by OMPC through the Redfish protocol. Events are also not logged. How do I troubleshoot and resolve the issue?
- I discovered a server through the Redfish protocol. When I tried to manage the server, the events are not logged in the event list. What do I do now?
- Upgrade failure recovery on Microsoft Windows operating system
- Upgrade failure recovery on Linux operating system

Table 5. Time Windows and Intervals
Time Window Description Interval
15Min 15 minutes 1 minute
1H 1 hour 3 minutes
1D 1 day 1 hour
1W 1 week 6 hours
1M 1 month 1 day
3M 3 months 1 week
1Y 1 year 2 weeks
NOTE: This table lists the interval when the sampling interval is at the default value (1 minute). Changing the sample interval
results in interval changes for the 15Min and 1H time windows. If you change the sampling interval to 3 minutes, the interval of
the 15Min time window is 3 minutes. If you change the sampling interval to 6 minutes, the interval of the 15Min time window is 3
minutes and the interval of the 1H time window is 6 minutes.
Temperature Details for a Dierent Time Window
Click the arrows < > to view the details for the previous/next sampling time, or click the double arrows << >> to view the details for the
previous/next page of results for the current time window. You can click Average, Maximum, or Minimum to display the selected value.
• Average: The average value from the previous time point to the current time point.
• Maximum: The maximum value from the previous time point to the current time point.
• Minimum: The minimum value from the previous time point to the current time point.
For example, you view temperature details in the 1H (1 hour) window and the maximum value at 15:00 shows 40°C and the time interval is
6 minutes. This value would represent that the maximum temperature from 14:54 to 15:00 is 40°C.
Chassis Details
The Chassis Details table appears when you select a chassis on the Devices screen. Chassis Details lists all blade servers within the
chassis and their temperature details in a table, including:
• Device: Device name.
• Average: The average value of the latest sampling interval.
• Maximum: The maximum value of the latest sampling interval.
• Minimum: The minimum value of the latest sampling interval.
NOTE
: You can set the time interval (the period from a time point to the next time point) in the Settings > General page. For
information on conguring the interval, see Monitoring Settings.
NOTE: The Average, Maximum, or Minimum eld displays NA if no data is available—for example, when the blade server is an
Unsupported device.
82 Temperature Monitoring