
Users Guide
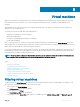

Table Of Contents
- Dell EMC OpenManage Power Center 4.0 User’s Guide
- Overview
- Getting started
- Using OpenManage Power Center
- Preinstallation requirement for OpenManage Power Center
- Using Power Center on Microsoft Windows operating systems
- Installing OpenManage Power Center on Microsoft Windows Server
- Installed directories in Windows
- OpenManage Power Center services on Microsoft Windows operating systems
- Upgrading Power Center on Microsoft Windows operating systems
- Uninstalling OpenManage Power Center on Microsoft Windows operating system
- Launching OpenManage Power Center on Microsoft Windows operating systems
- Configuring Enhanced Security Configuration for Internet Explorer
- Using OpenManage Power Center on Linux operating systems
- Using OpenManage Power Center through Command Line Interface
- Command Line Interface error handling
- Command Line Interface commands
- help
- add_profile
- update_profile
- add_device
- update_device
- rediscover_device
- find_device
- remove_profile
- delete_device
- add_group
- delete_group
- update_group
- add_device_to_group
- remove_device_from_group
- move_device
- move_group
- add_group_to_group
- List commands
- list_device_props
- list_devices
- list_group_props
- list_groups
- list_report_groups
- list_reports
- run_report
- discover_device
- backup_database
- restore_database
- add_ssh_server_key
- remove_ssh_server_key
- list_ssh_server_key
- Command line interface error codes
- Access control
- Task management
- Device Management
- Virtual machines
- Power Monitoring
- Temperature Monitoring
- Policies
- Analysis
- Managing reports
- Event Management
- Security
- Configuring settings
- Logs
- Troubleshooting
- Why am I being required to log in more than once by Power Center?
- Why can’t I access the Power Center management console from a Web browser, even though the Power Center server is running normally?
- Why was I automatically logged out of Power Center?
- Why did my connection to iDRAC6 devices (PowerEdge Servers) fail, when the network connection status is Connected?
- Why can’t Power Center receive events sent from devices?
- Why are previously-existing power policies (including EPR) still effective on devices when Power Center is corrupted or has been uninstalled?
- Why do I see the PostgreSQL error log "FATAL: terminating connection due to administrator command" in the Windows event log?
- Why I can’t open power center login page when I access it through Firefox 31?
- Why I encounter an error, “An internal error occurred. Contact the technical support for help: subordinate error code: 0x8f0c1301”, the Home page when OpenManage Power Center server is installed on SUSE Linux Enterprise Server 11 SP2?
- Why do I encounter a network exception while adding a LDAP user?
- Why do I encounter a network exception while adding a chassis to a group?
- In the compare report, why is the average power value of a device different when the service is stopped for a few hours?
- Why is the “policy return to normal” event not displayed when the only device in the Chassis Management Controller (CMC) is deleted?
- After discovering the devices, incorrect device information is displayed? Why is this happening?
- I am not able to view the power headroom graph on the home screen. How do I troubleshoot?
- I am not able to manage the servers discovered by OMPC through the Redfish protocol. Events are also not logged. How do I troubleshoot and resolve the issue?
- I discovered a server through the Redfish protocol. When I tried to manage the server, the events are not logged in the event list. What do I do now?
- Upgrade failure recovery on Microsoft Windows operating system
- Upgrade failure recovery on Linux operating system

Viewing a power history graph
OpenManage Power Center provides a visual representation of the power history of the system devices.
1 In the left pane, click Devices > All Devices or Devices > Managed Group.
2 From the list of devices, select a device.
The details of the device are displayed in the Details section.
3 In the Details section, click the Thresholds tab.
4 Click View History next to Power Alert Thresholds.
The Power History — <device> window is displayed.
5 Select the time period and attributes displayed:
a To select the time period represented in the graph, click the buttons along the top of the graph.
b To add or delete attributes, select from the listed options; click the option to toggle its addition or removal from the graph:
• Power
• Upper Warning
• Upper Critical
NOTE: To view specic numbers related to each attribute displayed in any section of the graph, move the pointer over
the graph.
6 To move along the data stream over time, click the navigation arrows below the graph.
Viewing system airow graph
iDRAC provides an accurate calculation of the server’s Cubic Feet Per Minute (CFM) value. The CFM value is a measure of the net system
airow to the servers. This value is used in Power Thermal Aware Scheduling (PTAS), balancing the data center workload, ecient server
utilization, and thermal management from a rack level. CFM or the system airow graph is useful from a group level (data center, room,
aisle, rack, or custom groups). The values are collected only from the devices that support this feature.
1 In the left pane, click Devices > Managed Group
2 Select the required data center, room, aisle, or rack in the data center.
The details of the selected entity are displayed in the Details section
3 Click System Airow History.
The System Airow History — <data center name> window is displayed.
4 Select the time period and attributes displayed:
a To select the time period represented in the graph, click the buttons along the top of the graph.
NOTE
: To move along the data stream over time, click the navigation arrows below the graph.
NOTE: A rack may not be displayed in the rack utilization graph if:
• The actual power of a device or devices in the rack exceeds the specied power capacity.
• The estimated maximum power for a device in the rack is not set.
Monitoring PDU
Using OMPC, you can view the PDU socket connection mapping with the devices. Starting OMPC 3.2, you can also monitor the
temperature, humidity, and other necessary metrics in a data center by using environmental sensors.
To monitor a PDU, click Devices in the left pane, navigate to the required PDU, view the Details section of the screen.
The instantaneous power value of the PDU is displayed, and the details section of the screen also lists the PDU details read from the
device. It displays NA when the data is not provided on the PDU device.
Power Monitoring
79