
Users Guide
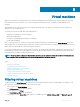

Table Of Contents
- Dell EMC OpenManage Power Center 4.0 User’s Guide
- Overview
- Getting started
- Using OpenManage Power Center
- Preinstallation requirement for OpenManage Power Center
- Using Power Center on Microsoft Windows operating systems
- Installing OpenManage Power Center on Microsoft Windows Server
- Installed directories in Windows
- OpenManage Power Center services on Microsoft Windows operating systems
- Upgrading Power Center on Microsoft Windows operating systems
- Uninstalling OpenManage Power Center on Microsoft Windows operating system
- Launching OpenManage Power Center on Microsoft Windows operating systems
- Configuring Enhanced Security Configuration for Internet Explorer
- Using OpenManage Power Center on Linux operating systems
- Using OpenManage Power Center through Command Line Interface
- Command Line Interface error handling
- Command Line Interface commands
- help
- add_profile
- update_profile
- add_device
- update_device
- rediscover_device
- find_device
- remove_profile
- delete_device
- add_group
- delete_group
- update_group
- add_device_to_group
- remove_device_from_group
- move_device
- move_group
- add_group_to_group
- List commands
- list_device_props
- list_devices
- list_group_props
- list_groups
- list_report_groups
- list_reports
- run_report
- discover_device
- backup_database
- restore_database
- add_ssh_server_key
- remove_ssh_server_key
- list_ssh_server_key
- Command line interface error codes
- Access control
- Task management
- Device Management
- Virtual machines
- Power Monitoring
- Temperature Monitoring
- Policies
- Analysis
- Managing reports
- Event Management
- Security
- Configuring settings
- Logs
- Troubleshooting
- Why am I being required to log in more than once by Power Center?
- Why can’t I access the Power Center management console from a Web browser, even though the Power Center server is running normally?
- Why was I automatically logged out of Power Center?
- Why did my connection to iDRAC6 devices (PowerEdge Servers) fail, when the network connection status is Connected?
- Why can’t Power Center receive events sent from devices?
- Why are previously-existing power policies (including EPR) still effective on devices when Power Center is corrupted or has been uninstalled?
- Why do I see the PostgreSQL error log "FATAL: terminating connection due to administrator command" in the Windows event log?
- Why I can’t open power center login page when I access it through Firefox 31?
- Why I encounter an error, “An internal error occurred. Contact the technical support for help: subordinate error code: 0x8f0c1301”, the Home page when OpenManage Power Center server is installed on SUSE Linux Enterprise Server 11 SP2?
- Why do I encounter a network exception while adding a LDAP user?
- Why do I encounter a network exception while adding a chassis to a group?
- In the compare report, why is the average power value of a device different when the service is stopped for a few hours?
- Why is the “policy return to normal” event not displayed when the only device in the Chassis Management Controller (CMC) is deleted?
- After discovering the devices, incorrect device information is displayed? Why is this happening?
- I am not able to view the power headroom graph on the home screen. How do I troubleshoot?
- I am not able to manage the servers discovered by OMPC through the Redfish protocol. Events are also not logged. How do I troubleshoot and resolve the issue?
- I discovered a server through the Redfish protocol. When I tried to manage the server, the events are not logged in the event list. What do I do now?
- Upgrade failure recovery on Microsoft Windows operating system
- Upgrade failure recovery on Linux operating system

For more information on conguring default units and energy consumption, see Conguring Energy Consumption Cost Settings.
Viewing power details
In the left pane, click Devices > All Devices or Devices > Managed Groups. Click the icon for a device or group, then refer to the power
detail section of the screen. While OpenManage Power Center does provide power information for PDU and other devices and groups,
Power Center does not provide power details for UPS devices.
For devices and groups (excluding PDU and UPS), by default, the Power graph displays the power details for the previous hour. Refer to
Viewing Power History Graph for details on accessing a device or group graph.
NOTE: CMC infrastructure power adjustments are not considered when OMPC reports the modular server power reading. It is
recommended to view the total power from a chassis level.
Power details for the current time window
You can view power details for the current time window by clicking a time window tab. The following table describes the time windows and
their associated intervals:
Table 4. Time windows and intervals
Time Window Description Interval
15Min 15 minutes 1 minute
1H 1 hour 3 minutes
1D 1 day 1 hour
1W 1 week 6 hours
1M 1 month 1 day
3M 3 months 1 week
1Y 1 year 2 weeks
NOTE: This table lists the interval when the sampling interval is at the default value (1 minute). Changing the sample interval
results in interval changes for the 15Min and 1H time windows. If you change the sampling interval to 3 minutes, the interval of
the 15Min time window is 3 minutes. If you change the sampling interval to 6 minutes, the interval of the 15Min time window is 3
minutes and the interval of the 1H time window is 6 minutes.
Power details for a dierent time window
Click the arrows < > to view the details for the previous/next sampling time, or click the double arrows << >> to view the details for the
previous/next page of results for the current time window. You can click Average, Maximum, or Minimum to display the selected value.
• Average: The average value from the previous time point to the current time point.
• Maximum: The maximum value from the previous time point to the current time point.
• Minimum: The minimum value from the previous time point to the current time point.
For example, you view power details in the 1H (1 hour) window and the maximum value at 15:00 shows 500W and the time interval is 6
minutes. This value would represent that the maximum power consumption from 14:54 to 15:00 is 500W.
Power Monitoring
77