
Users Guide

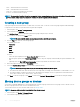
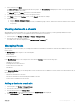
Table Of Contents
- Dell EMC OpenManage Power Center 4.0 User’s Guide
- Overview
- Getting started
- Using OpenManage Power Center
- Preinstallation requirement for OpenManage Power Center
- Using Power Center on Microsoft Windows operating systems
- Installing OpenManage Power Center on Microsoft Windows Server
- Installed directories in Windows
- OpenManage Power Center services on Microsoft Windows operating systems
- Upgrading Power Center on Microsoft Windows operating systems
- Uninstalling OpenManage Power Center on Microsoft Windows operating system
- Launching OpenManage Power Center on Microsoft Windows operating systems
- Configuring Enhanced Security Configuration for Internet Explorer
- Using OpenManage Power Center on Linux operating systems
- Using OpenManage Power Center through Command Line Interface
- Command Line Interface error handling
- Command Line Interface commands
- help
- add_profile
- update_profile
- add_device
- update_device
- rediscover_device
- find_device
- remove_profile
- delete_device
- add_group
- delete_group
- update_group
- add_device_to_group
- remove_device_from_group
- move_device
- move_group
- add_group_to_group
- List commands
- list_device_props
- list_devices
- list_group_props
- list_groups
- list_report_groups
- list_reports
- run_report
- discover_device
- backup_database
- restore_database
- add_ssh_server_key
- remove_ssh_server_key
- list_ssh_server_key
- Command line interface error codes
- Access control
- Task management
- Device Management
- Virtual machines
- Power Monitoring
- Temperature Monitoring
- Policies
- Analysis
- Managing reports
- Event Management
- Security
- Configuring settings
- Logs
- Troubleshooting
- Why am I being required to log in more than once by Power Center?
- Why can’t I access the Power Center management console from a Web browser, even though the Power Center server is running normally?
- Why was I automatically logged out of Power Center?
- Why did my connection to iDRAC6 devices (PowerEdge Servers) fail, when the network connection status is Connected?
- Why can’t Power Center receive events sent from devices?
- Why are previously-existing power policies (including EPR) still effective on devices when Power Center is corrupted or has been uninstalled?
- Why do I see the PostgreSQL error log "FATAL: terminating connection due to administrator command" in the Windows event log?
- Why I can’t open power center login page when I access it through Firefox 31?
- Why I encounter an error, “An internal error occurred. Contact the technical support for help: subordinate error code: 0x8f0c1301”, the Home page when OpenManage Power Center server is installed on SUSE Linux Enterprise Server 11 SP2?
- Why do I encounter a network exception while adding a LDAP user?
- Why do I encounter a network exception while adding a chassis to a group?
- In the compare report, why is the average power value of a device different when the service is stopped for a few hours?
- Why is the “policy return to normal” event not displayed when the only device in the Chassis Management Controller (CMC) is deleted?
- After discovering the devices, incorrect device information is displayed? Why is this happening?
- I am not able to view the power headroom graph on the home screen. How do I troubleshoot?
- I am not able to manage the servers discovered by OMPC through the Redfish protocol. Events are also not logged. How do I troubleshoot and resolve the issue?
- I discovered a server through the Redfish protocol. When I tried to manage the server, the events are not logged in the event list. What do I do now?
- Upgrade failure recovery on Microsoft Windows operating system
- Upgrade failure recovery on Linux operating system

3 Click Details > Resource Utilization History.
The Resource Utilization History-<Entity> window is displayed, where an <Entity> is the selected device.
4 Click X in the upper-right corner to return to the Managed Groups tab.
Filtering devices
The lter feature in the All Devices tab helps you to view devices that share a certain attribute. For example, you can view devices of a
certain device type or devices that share an IP range.
1 In the left pane, click Devices.
The All Devices tab is displayed by default.
2 In the task menu, click Filter.
The Device Filter window is displayed.
3 Select the lter by clicking Select Filter drop-down list.
4 (Optional) Enter a name for the lter in the Filter Name text box.
5 Do one of the following:
• Select the IP Range check box, and enter the start and end IP address of devices.
• Select the Date Range check box, and enter the start and end date of device discovery. Enter the dates manually following the
format MM/DD/YYYY, or select the dates from the calendar. Devices discovered from 00:00:00 of start date to 00:00:00 of the
next day after the end date are displayed. For example, if you enter the ltering option 01/01/2015 as both start date and end date,
all devices discovered between 00:00:00 of 01/01/2015 and 00:00:00 of 01/02/2015 are displayed.
• Select the Device Type check box, and select the device type from the drop-down list. The available options are:
• Server
• Chassis
• PDU
• UPS
• Unsupported
NOTE
: You can select multiple device types.
• Select the Power Capability check box, and select the power capability of the device from the drop-down list. The available
options are:
• Unknown — Indicates that the power capability of the device is unknown.
• None — Indicates that the device does not have power capability.
• Monitor — Indicates that the device has aggregate power monitoring capability.
• Monitor and capping — Indicates that device has aggregate power monitoring and power capping capability.
• Monitor, upgradeable — Indicates that the device can be upgraded with the iDRAC enterprise license for power capping.
• Instantaneous power — Indicates that the device has instantaneous power monitoring capability.
• Outlet Power — Indicates that the devices are ltered based on the specied outlet power.
• Monitor through PDU — Indicates the devices that can be monitored using PDU.
NOTE
: You can select multiple power capabilities.
• Select the Protocol check box, and select the protocols used for communication. The available options are:
• IPMI (Server)
• WS-MAN (Chassis)
• SNMPv1v2c (UPS/PDU)
• SNMPv3 (UPS/PDU)
• HTTPS
• SSH
• Redsh
64
Device Management