
Users Guide
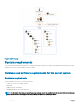

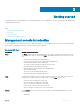
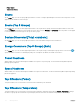
Table Of Contents
- Dell EMC OpenManage Power Center 4.0 User’s Guide
- Overview
- Getting started
- Using OpenManage Power Center
- Preinstallation requirement for OpenManage Power Center
- Using Power Center on Microsoft Windows operating systems
- Installing OpenManage Power Center on Microsoft Windows Server
- Installed directories in Windows
- OpenManage Power Center services on Microsoft Windows operating systems
- Upgrading Power Center on Microsoft Windows operating systems
- Uninstalling OpenManage Power Center on Microsoft Windows operating system
- Launching OpenManage Power Center on Microsoft Windows operating systems
- Configuring Enhanced Security Configuration for Internet Explorer
- Using OpenManage Power Center on Linux operating systems
- Using OpenManage Power Center through Command Line Interface
- Command Line Interface error handling
- Command Line Interface commands
- help
- add_profile
- update_profile
- add_device
- update_device
- rediscover_device
- find_device
- remove_profile
- delete_device
- add_group
- delete_group
- update_group
- add_device_to_group
- remove_device_from_group
- move_device
- move_group
- add_group_to_group
- List commands
- list_device_props
- list_devices
- list_group_props
- list_groups
- list_report_groups
- list_reports
- run_report
- discover_device
- backup_database
- restore_database
- add_ssh_server_key
- remove_ssh_server_key
- list_ssh_server_key
- Command line interface error codes
- Access control
- Task management
- Device Management
- Virtual machines
- Power Monitoring
- Temperature Monitoring
- Policies
- Analysis
- Managing reports
- Event Management
- Security
- Configuring settings
- Logs
- Troubleshooting
- Why am I being required to log in more than once by Power Center?
- Why can’t I access the Power Center management console from a Web browser, even though the Power Center server is running normally?
- Why was I automatically logged out of Power Center?
- Why did my connection to iDRAC6 devices (PowerEdge Servers) fail, when the network connection status is Connected?
- Why can’t Power Center receive events sent from devices?
- Why are previously-existing power policies (including EPR) still effective on devices when Power Center is corrupted or has been uninstalled?
- Why do I see the PostgreSQL error log "FATAL: terminating connection due to administrator command" in the Windows event log?
- Why I can’t open power center login page when I access it through Firefox 31?
- Why I encounter an error, “An internal error occurred. Contact the technical support for help: subordinate error code: 0x8f0c1301”, the Home page when OpenManage Power Center server is installed on SUSE Linux Enterprise Server 11 SP2?
- Why do I encounter a network exception while adding a LDAP user?
- Why do I encounter a network exception while adding a chassis to a group?
- In the compare report, why is the average power value of a device different when the service is stopped for a few hours?
- Why is the “policy return to normal” event not displayed when the only device in the Chassis Management Controller (CMC) is deleted?
- After discovering the devices, incorrect device information is displayed? Why is this happening?
- I am not able to view the power headroom graph on the home screen. How do I troubleshoot?
- I am not able to manage the servers discovered by OMPC through the Redfish protocol. Events are also not logged. How do I troubleshoot and resolve the issue?
- I discovered a server through the Redfish protocol. When I tried to manage the server, the events are not logged in the event list. What do I do now?
- Upgrade failure recovery on Microsoft Windows operating system
- Upgrade failure recovery on Linux operating system

Underutilized Racks
This option enables you to view the names of the racks in which the power capacity and rack space remain unused. Click Actual or
Percentage to arrange the racks by the actual or utilization percentage of power and rack space.
Top 10 (Most Recent) Critical and Warning Events
This option enables you to view the recent top 10 critical and warning events.
Customizable Dashboard Settings
This option enables you to customize the dashboard available on the home page. You can select individual information referred as dashlets,
from a list of predened set of dashlets. Click
to select the required dashlets.
Power History
A visual representation of the power history of the system groups.
Temperature History
A visual representation of the temperature history of the system groups.
Common use cases
This section provides a standard scenario to help Administrators to get started with OpenManage Power Center.
If you are a rst-time user, you can follow the sequence of steps 1-5 to install OpenManage Power Center and set up the group structure
for monitoring your data center. Then, see steps 6, 7, and/or 8 to use OpenManage Power Center for monitoring, comparing power and
temperature data between devices and/or time slots, and creating policies:
1 Install OpenManage Power Center in a Windows or Linux environment
2 Launch OpenManage Power Center.
3 Discover devices and add one or more devices from the network.
4 Manage your devices. You can delete, edit, and lter devices.
5 Create one or more data center group structures.
6 Create one or more power policies, and apply to devices.
7 Create power control tasks.
8 Monitor Power and Temperature events on devices.
9 Generate reports and compare power or temperature status and the energy cost for two or three devices or groups.
Getting started
19