
Users Guide

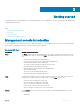
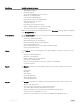
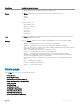
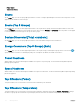
Table Of Contents
- Dell EMC OpenManage Power Center 4.0 User’s Guide
- Overview
- Getting started
- Using OpenManage Power Center
- Preinstallation requirement for OpenManage Power Center
- Using Power Center on Microsoft Windows operating systems
- Installing OpenManage Power Center on Microsoft Windows Server
- Installed directories in Windows
- OpenManage Power Center services on Microsoft Windows operating systems
- Upgrading Power Center on Microsoft Windows operating systems
- Uninstalling OpenManage Power Center on Microsoft Windows operating system
- Launching OpenManage Power Center on Microsoft Windows operating systems
- Configuring Enhanced Security Configuration for Internet Explorer
- Using OpenManage Power Center on Linux operating systems
- Using OpenManage Power Center through Command Line Interface
- Command Line Interface error handling
- Command Line Interface commands
- help
- add_profile
- update_profile
- add_device
- update_device
- rediscover_device
- find_device
- remove_profile
- delete_device
- add_group
- delete_group
- update_group
- add_device_to_group
- remove_device_from_group
- move_device
- move_group
- add_group_to_group
- List commands
- list_device_props
- list_devices
- list_group_props
- list_groups
- list_report_groups
- list_reports
- run_report
- discover_device
- backup_database
- restore_database
- add_ssh_server_key
- remove_ssh_server_key
- list_ssh_server_key
- Command line interface error codes
- Access control
- Task management
- Device Management
- Virtual machines
- Power Monitoring
- Temperature Monitoring
- Policies
- Analysis
- Managing reports
- Event Management
- Security
- Configuring settings
- Logs
- Troubleshooting
- Why am I being required to log in more than once by Power Center?
- Why can’t I access the Power Center management console from a Web browser, even though the Power Center server is running normally?
- Why was I automatically logged out of Power Center?
- Why did my connection to iDRAC6 devices (PowerEdge Servers) fail, when the network connection status is Connected?
- Why can’t Power Center receive events sent from devices?
- Why are previously-existing power policies (including EPR) still effective on devices when Power Center is corrupted or has been uninstalled?
- Why do I see the PostgreSQL error log "FATAL: terminating connection due to administrator command" in the Windows event log?
- Why I can’t open power center login page when I access it through Firefox 31?
- Why I encounter an error, “An internal error occurred. Contact the technical support for help: subordinate error code: 0x8f0c1301”, the Home page when OpenManage Power Center server is installed on SUSE Linux Enterprise Server 11 SP2?
- Why do I encounter a network exception while adding a LDAP user?
- Why do I encounter a network exception while adding a chassis to a group?
- In the compare report, why is the average power value of a device different when the service is stopped for a few hours?
- Why is the “policy return to normal” event not displayed when the only device in the Chassis Management Controller (CMC) is deleted?
- After discovering the devices, incorrect device information is displayed? Why is this happening?
- I am not able to view the power headroom graph on the home screen. How do I troubleshoot?
- I am not able to manage the servers discovered by OMPC through the Redfish protocol. Events are also not logged. How do I troubleshoot and resolve the issue?
- I discovered a server through the Redfish protocol. When I tried to manage the server, the events are not logged in the event list. What do I do now?
- Upgrade failure recovery on Microsoft Windows operating system
- Upgrade failure recovery on Linux operating system

Main Screen Available actions on the screen
• Identify and analyze the potential cooling issues in a data center
Events The Events screen lists the system and log events at the following severity levels:
• Critical
• Warning
• Info
On this screen you can:
• Acknowledge Events
• Add a note to an event
• Delete Events
• Sort events
• Filter events
• Export Events
Logs The Logs screen displays information about unexpected or informational events or internal errors that
occur in OpenManage Power Center.
Settings From the Settings submenus you can congure all OpenManage Power Center settings, including:
• General — Congure the timeout for console and device communication.
• Monitoring — Congure the power/thermal units and energy consumption parameters.
• Alerts — Congure alerts for SNMP traps, enable or disable sending alerts through emails, congure
email recipients, and event severity-level.
• SMTP — Congure SMTP parameters for sending alert emails.
• Database — Congure database compression and purging policy.
• Directory — Congure Lightweight Directory Access Protocol (LDAP) settings to support
authentication through LDAP. This tab is displayed only on systems running the Linux operating
systems where OpenManage Power Center is installed.
• User and Group Accounts — Manage user or group accounts for accessing OpenManage Power
Center.
• Roles — Managing roles and rights.
• Licensing — Manage the issued licenses.
• Inventory — Track chassis inventory.
Home page
On the Home page, you can view the following information.
• Events (Overall)
• Events (Top 5 Groups)
• Devices Discovered [Total: <number>]
• Energy Consumers (Top 5 Groups) [kwh]
• Power Headroom
• Space Headroom
• Top Oenders (Power)
• Top Oenders (Temperature)
• Underutilized Racks (Power)
• Underutilized Racks (Space)
• Top 10 Events (Critical and Warning)
Getting started
17