
Users Guide
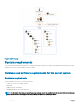

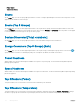
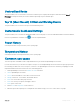
Table Of Contents
- Dell EMC OpenManage Power Center 4.0 User’s Guide
- Overview
- Getting started
- Using OpenManage Power Center
- Preinstallation requirement for OpenManage Power Center
- Using Power Center on Microsoft Windows operating systems
- Installing OpenManage Power Center on Microsoft Windows Server
- Installed directories in Windows
- OpenManage Power Center services on Microsoft Windows operating systems
- Upgrading Power Center on Microsoft Windows operating systems
- Uninstalling OpenManage Power Center on Microsoft Windows operating system
- Launching OpenManage Power Center on Microsoft Windows operating systems
- Configuring Enhanced Security Configuration for Internet Explorer
- Using OpenManage Power Center on Linux operating systems
- Using OpenManage Power Center through Command Line Interface
- Command Line Interface error handling
- Command Line Interface commands
- help
- add_profile
- update_profile
- add_device
- update_device
- rediscover_device
- find_device
- remove_profile
- delete_device
- add_group
- delete_group
- update_group
- add_device_to_group
- remove_device_from_group
- move_device
- move_group
- add_group_to_group
- List commands
- list_device_props
- list_devices
- list_group_props
- list_groups
- list_report_groups
- list_reports
- run_report
- discover_device
- backup_database
- restore_database
- add_ssh_server_key
- remove_ssh_server_key
- list_ssh_server_key
- Command line interface error codes
- Access control
- Task management
- Device Management
- Virtual machines
- Power Monitoring
- Temperature Monitoring
- Policies
- Analysis
- Managing reports
- Event Management
- Security
- Configuring settings
- Logs
- Troubleshooting
- Why am I being required to log in more than once by Power Center?
- Why can’t I access the Power Center management console from a Web browser, even though the Power Center server is running normally?
- Why was I automatically logged out of Power Center?
- Why did my connection to iDRAC6 devices (PowerEdge Servers) fail, when the network connection status is Connected?
- Why can’t Power Center receive events sent from devices?
- Why are previously-existing power policies (including EPR) still effective on devices when Power Center is corrupted or has been uninstalled?
- Why do I see the PostgreSQL error log "FATAL: terminating connection due to administrator command" in the Windows event log?
- Why I can’t open power center login page when I access it through Firefox 31?
- Why I encounter an error, “An internal error occurred. Contact the technical support for help: subordinate error code: 0x8f0c1301”, the Home page when OpenManage Power Center server is installed on SUSE Linux Enterprise Server 11 SP2?
- Why do I encounter a network exception while adding a LDAP user?
- Why do I encounter a network exception while adding a chassis to a group?
- In the compare report, why is the average power value of a device different when the service is stopped for a few hours?
- Why is the “policy return to normal” event not displayed when the only device in the Chassis Management Controller (CMC) is deleted?
- After discovering the devices, incorrect device information is displayed? Why is this happening?
- I am not able to view the power headroom graph on the home screen. How do I troubleshoot?
- I am not able to manage the servers discovered by OMPC through the Redfish protocol. Events are also not logged. How do I troubleshoot and resolve the issue?
- I discovered a server through the Redfish protocol. When I tried to manage the server, the events are not logged in the event list. What do I do now?
- Upgrade failure recovery on Microsoft Windows operating system
- Upgrade failure recovery on Linux operating system

Feature Description
Stranded Power Information Stranded power, also known as headroom, is the excess power
available for a device group. OpenManage Power Center helps you
to calculate the stranded power for devices and device groups. The
formula for calculating stranded power is:
Stranded Power(t) = Allocated Power(t) - Peak
Power Consumption(t)
where (t) is calculated as a function of time. You can specify a
time range in the report. By default, (t) is the time range of
monitored data.
Power and Thermal Analysis Enables you to analyze power and the thermal characteristics. You
can also analyze the underutilized servers and identify the potential
cooling issues in a data center.
Integration with the iDRAC Location Enables you to replicate the data center hierarchy on the iDRAC
location based on OMPC physical location modeling.
Database Backup Enables you to schedule a backup of all the policies, recovery logs,
or the OMPC database. The backup data can be used on a dierent
OMPC server or can be used as a restore point if there is a disk
failure.
Measuring virtual machine power consumption Enables you to measure the power utilized by virtual machines. The
measured values help you to balance the workload between VMs
based on power consumption and identify any issues with
assignment of VMs to the servers.
New in this release
• Support for new platforms, including 14th generation of PowerEdge systems. For more information, see Supported and unsupported
devices.
• Support to monitor the virtual machine power consumption.
• Support for Redsh protocol.
• 3 additional pre-dened templates to create, customize, run and export reports. See Managing reports.
Topology
The following gure shows how to use a web browser to access the Power Center server and manage the data center.
Overview
11