Dell EMC OpenManage Power Center 4.
Notes, cautions, and warnings NOTE: A NOTE indicates important information that helps you make better use of your product. CAUTION: A CAUTION indicates either potential damage to hardware or loss of data and tells you how to avoid the problem. WARNING: A WARNING indicates a potential for property damage, personal injury, or death. Copyright © 2017 Dell Inc. or its subsidiaries. All rights reserved. Dell, EMC, and other trademarks are trademarks of Dell Inc. or its subsidiaries.
Contents 1 Overview...................................................................................................................................................... 10 Key features...................................................................................................................................................................... 10 New in this release..........................................................................................................................................
Launching Power Center in Linux............................................................................................................................ 30 4 Using OpenManage Power Center through Command Line Interface .......................................................... 31 Command Line Interface error handling........................................................................................................................32 Command Line Interface commands.....................................
Managing user roles and privileges................................................................................................................................48 Adding a custom role................................................................................................................................................. 48 Editing a role...............................................................................................................................................................
8 Virtual machines.......................................................................................................................................... 73 Filtering virtual machines.................................................................................................................................................73 Creating a new virtual machine group...........................................................................................................................
Deleting a policy............................................................................................................................................................... 90 Filtering policies................................................................................................................................................................90 12 Analysis............................................................................................................................................
Operating system hardening.......................................................................................................................................... 112 Audit log............................................................................................................................................................................112 Managing certificates.........................................................................................................................................
Why do I see the PostgreSQL error log "FATAL: terminating connection due to administrator command" in the Windows event log?................................................................................................................................................126 Why I can’t open power center login page when I access it through Firefox 31?.................................................. 127 Why I encounter an error, “An internal error occurred.
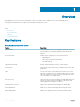
1 Overview OpenManage Power Center is a power management solution for the data center. It enables you to monitor and manage power consumption and temperature in your data center through the management console. Topics: • Key features • New in this release • Topology • System requirements Key features Table 1.
Feature Description Stranded Power Information Stranded power, also known as headroom, is the excess power available for a device group. OpenManage Power Center helps you to calculate the stranded power for devices and device groups. The formula for calculating stranded power is: Stranded Power(t) = Allocated Power(t) - Peak Power Consumption(t) where (t) is calculated as a function of time. You can specify a time range in the report. By default, (t) is the time range of monitored data.
Figure 1. OMPC Topology System requirements This section describes the general requirements of OMPC and provides information on supported operating systems and the basic system requirements for server system and devices that use OMPC. Hardware and software requirements for the server system Hardware requirements You must install Power Center on a system with at least: • A dual-core processor of 2.
Software requirements OpenManage Power Center supports the following operating systems: • Microsoft Windows Server 2012 x64 Standard Edition • Microsoft Windows Server 2012 x64 Data Center Edition • Microsoft Windows Server 2012 x64 Essential Edition • Microsoft Windows Server 2012 R2 Essentials Edition • Microsoft Windows Server 2012 R2 Standard Edition • Microsoft Windows Server 2012 R2 Datacenter Edition • Microsoft Windows Server 2016 Standard Edition • Microsoft Windows Server 2016 Data
NOTE: For a list of Dell OpenManage Power Center-supported devices, see Supported devices and unsupported devices.
2 Getting started This chapter introduces the OpenManage Power Center management console, and presents several use cases that describe standard uses of OpenManage Power Center. Topics: • Management console introduction • Home page • Common use cases • Supported and unsupported devices Management console introduction To use OpenManage Power Center, you must open a Web browser and log in.
Main Screen Available actions on the screen • • • • • • • • • • • Add unsupported devices Create logical groups Set the estimated maximum power for devices Edit devices or managed groups Delete devices or managed groups Refresh the list of devices or managed groups Filter and search the list of devices Sort the list of devices Move devices from one group to another Enable or disable Emergency Power Reduction (EPR) View details of the devices or managed groups All devices, whether grouped or unassigned ar
Main Screen Available actions on the screen • Events Identify and analyze the potential cooling issues in a data center The Events screen lists the system and log events at the following severity levels: • • • Critical Warning Info On this screen you can: • • • • • • Acknowledge Events Add a note to an event Delete Events Sort events Filter events Export Events Logs The Logs screen displays information about unexpected or informational events or internal errors that occur in OpenManage Power Center
• Power History • Temperature History Events On the Home page, you can view a pie graph representation of events occurring in OpenManage Power Center. Move the pointer over the graph to view the number of each event type. Events (Top 5 Groups) On the Home page, you can view a bar graph representation of the top five device groups, that have the highest number of events with severity as Critical, followed by the events that has the events with severity as Warning and Information.
Underutilized Racks This option enables you to view the names of the racks in which the power capacity and rack space remain unused. Click Actual or Percentage to arrange the racks by the actual or utilization percentage of power and rack space. Top 10 (Most Recent) Critical and Warning Events This option enables you to view the recent top 10 critical and warning events. Customizable Dashboard Settings This option enables you to customize the dashboard available on the home page.
Supported and unsupported devices You can discover supported devices, and create a group structure to build out the data center. Power Center cannot discover or manage all device types, and unsupported devices must be manually added to make the data center group structure complete. For supported devices: • Device types include chassis, server, UPS, and PDU. • Set the connection protocol and credential information so that the device can communicate with Power Center.
Category Supported Platform HP IBM Cisco Intel Validated Model • • • • • • • • • • • • • • • • • • • • • • • • • • • • • • PowerEdge R440 Server PowerEdge R530 Server PowerEdge R530XD Server PowerEdge R540 Server PowerEdge R540XD Server PowerEdge R630 Server PowerEdge R730 Server PowerEdge R730Xd Server PowerEdge R930 Server PowerEdge R640 Server PowerEdge R740 Server PowerEdge R740XD Server PowerEdge R940 Server PowerEdge M630 Server PowerEdge M640 Server PowerEdge M640 Server-VRTX PowerEdge M830 Ser
Category Supported Platform Chassis Dell Validated Model • • • PowerEdge M1000e VRTX Blade Enclosure PowerEdge FX2/FX2s NOTE: FX2s supports only the 13th generation of PowerEdge Servers.
Category Supported Platform Eaton Emerson Validated Model • • APC Smart-UPS 2200 RM APC Smart-UPS 3000 • Eaton Line interactive UPS w/ Web card PW5130I1750-XL2U • Emerson Online UPS w/ Web card GXT2-2700RT208 For unsupported devices: • Power Center does not communicate with unsupported devices; therefore, connection protocol and credential information is not necessary. • Unsupported devices cannot be discovered, they can only be added to the device list on the All Devices tab.
3 Using OpenManage Power Center This chapter explains how to install, uninstall, and launch OpenManage Power Center on Microsoft Windows and Linux platforms. Topics: • • • Preinstallation requirement for OpenManage Power Center Using Power Center on Microsoft Windows operating systems Using OpenManage Power Center on Linux operating systems Preinstallation requirement for OpenManage Power Center Ensure that you assess the following before installing OMPC. • • • Administrator privileges.
The user name must be: 6 • Unique for each OpenManage Power Center user • Up to 20 uppercase or lowercase printable characters, except “/\[]:;|=,+'*?<>.@ • Not case-sensitive Enter the password in the Password text box and then, in the Verify Password text box to confirm it. NOTE: The password must be a minimum of eight characters, with characters from at least three of the following categories: uppercase, lowercase, numeric, and non-alphanumeric.
NOTE: You cannot install OpenManage Power Center in the root folders of the Windows volume. You must select a non-root folder or another volume.
NOTE: On upgrading OpenManage Power Center to the latest version on remote systems, the data in the OpenManage Power Center database is not migrated to the latest version. NOTE: Do not cancel the upgrade process, if cancelled, rollback to the previous version may fail. This may also result in data loss. For more information on upgrading and steps to handle failure during upgrade, see Upgrade failure recovery on Microsoft Windows operating system.
Select a user account and enter your name and password. The OpenManage Power Center console is displayed. You can use the OpenManage Power Center functions. NOTE: To avoid the difference in timezone between your system and the server, ensure that the time zone of your system is same as that of the OMPC server.
4 Press to continue. The End User License Agreement appears. 5 Read the End User’s License Agreement (EULA), then type accept to continue. The Power Center License screen appears. 6 Review the license message, then press to continue. The HTTPS Setting screen appears. 7 Configure the HTTPS settings by entering a number from the list, then providing the information requested. • HTTPS Port—Enter a port number between 1000 and 9999.
• external — Other applications installed by OpenManage Power Center • logs — OpenManage Power Center event logs • pgdata (default) — Database files Power Center services in Linux OpenManage Power Center includes the following services on Linux platform installations: • Dell EMC OpenManage Power Center Database Services — The PostgreSQL internal database for OpenManage Power Center. • Dell EMC OpenManage Power Center DataCenter Manager Service — The OpenManage Power Center server core service.
4 Using OpenManage Power Center through Command Line Interface All commands supported by the command line interface (CLI) have the following format: ompc_cli [COMMAND] [GENERIC_OPTIONS] [COMMAND_OPTIONS] [COMMAND_TARGET] The operation must start with a valid [COMMAND]. Options can be entered anywhere after [COMMAND]. For each option that has a value, the value must be supplied immediately after the option.
Command Line Interface error handling On Microsoft Windows and Linux operating systems, an exit code is displayed indicating the successful execution of a command. An error code is displayed, if a command is not executed successfully. On Microsoft Windows operating system, when the command is successful, the CLI exit code is 0. Refer Command Line Interface Error Codes to know about specific error codes. On Linux operating system, when a command is successful, the CLI exit code is 0.
• ipmi_password • ipmi_key For Redfish, the properties are: • redfish_user • redfish_password • redfish_port • redfish_validate_cert For WS-Man, the properties are: • wsman_port • wsman_user • wsman_password • wsman_validate_cert (its value must be true or false) For HTTPS, the properties are: • https_port • https_user • https_password • https_validate_cert (its value must be true or false) For SSH, the properties are: • ssh_port • ssh_user • ssh_password • ssh_validate_ce
The update_profile command updates an existing discovery profile identified by profile_name in OMPC. The semantics of the command options are the same as those in add_profile. The protocol property set that can be updated depends on the protocol supported by this profile. If new_profile_name is provided, the profile_name is updated to the new_profile_name.
find_device Usage: ompc_cli find_device [-service_tag ] [] The find_device command is used to list all groups' name (fully qualified) the device identified by service tag or device_name belongs to. service_tag command option is supported. remove_profile Usage: ompc_cli remove_profile The remove_profile command removes a discovery profile. delete_device Usage: ompc_cli delete_device [-service_tag ] [] The delete_device command deletes a device.
The delete_group command deletes a group identified by GROUP_PATH. All devices in this group are removed. The devices still exists on the Devices page and in other groups that contain them. All subgroups are removed from this group. If a subgroup belongs to multiple parent groups, this subgroup still exists in the other parent groups. If the subgroup no longer belongs to any parent group (after being removed from the current parent), this subgroup is deleted from OMPC. This also applies to the group itself.
add_device_to_group Usage: ompc_cli add_device_to_group GROUP_PATH [-slot ] [-service_tag ] [] The add_device_to_group command adds a device to a group. If a device is added to a rack, the slot_num option is used to specify into which slot the device is added. If the value of the slot is -1, the system chooses a slot automatically. When adding UPS/PDU, if you do not provide a slot option, the UPS/PDU is attached to the rack.
The slot option is applicable only when moving a device (including a chassis) to a rack. It specifies which slot the device should be moved into. If it is not provided when moving a device to a rack, the CLI identifies a slot. When moving a UPS/PDU from one rack to another rack and the slot is not provided: • If the UPS/PDU is in a slot of a previous rack, the CLI selects one slot in the new rack. • If the UPS/PDU is attached in a previous rack, the CLI attaches it in the new rack.
When adding a chassis to a rack, the CLI chooses an available slot (if there is one available). If you want to specify a slot for the chassis in the rack, you must use the add_device_to_group command. List commands The following are generic rules for list commands: • The output of list commands is a simple table-like structure, where a comma-delimited list of column names will be output first, followed by the data, in comma-delimited format. There is one line per record.
list_groups Usage: ompc_cli list_groups [-unique] [GROUP_PATH] The list_groups command lists all child groups for the GROUP_PATH (immediate only). If no GROUP_PATH is supplied, the CLI lists all group paths or all unique groups in OMPC. Properties include the fully-qualified group name, group type, and member_count. The member_count property is the number of devices and groups immediately under the child group. [-unique] has no impact if GROUP_PATH is provided.
The REPORT_NAME is mandatory and specifies which saved report are run. The options -start_date and -end_date are optional: When supplied, they are used to run the report in precedence to the time range saved with the original report setting. If only -start_date is supplied, the current time is used as the end of the time range. If only end_date is supplied, the earliest time of monitoring data is used as the beginning of the time range.
The backup_database command is used to initiate the OMPC database restoration. The -path and -encrypt_password options must be supplied. The database restore process is complete. add_ssh_server_key Usage: ompc_cli add_ssh_server_key [-host_names ] [-key_type ] [-ssh_key ] The add_ssh_server_key command is used to add SSH keys to OMPC for device authentication. The -key_type, -host_names, and -ssh_keyare the supported command options.
• OMPC Database — 0x01 • DCM SDK — 0x02 • OMPC UI asset — 0x03 • DC Modeling — 0x04 • Overview — 0x05 • Monitoring — 0x06 • User Accounts — 0x07 • Setting — 0x08 • Event — 0x09 • Discovery — 0x0A • License — 0x0B • Policy — 0x0C • Connection Pool — 0x0D • Role/ Privilege — 0x0E • Login/ Logout — 0x0F • Profile — 0x10 • Available List — 0x11 • Security — 0x12 • Paging/Sorting/Filtering — 0x13 • Configuration — 0x14 • Unit Handler — 0x15 • Infrastructure — 0x16 • U
5 Access control This chapter provides information about access control in OpenManage Power Center, including: • Log in/Log out — Log into OpenManage Power Center by entering user account credentials. • User/Role/Privilege Management — After logging in, you can manage user accounts from the Settings > Users screen of the management console. OpenManage Power Center provides role-based access control; to use these controls, set up roles first, and then define the privileges for each role.
NOTE: You cannot log into OpenManage Power Center using SSO on the OpenManage Power Center server. You only can log into OpenManage Power Center using SSO remotely. NOTE: You must add the SSO user account to OpenManage Power Center before you can log in using SSO. You skip the login page and enter the Home page directly using SSO. • Windows Domain Account — Windows domain account. • Windows Local Account — Windows local account on the OpenManage Power Center server.
Logging in with Single Sign-on (SSO) SSO uses centralized authentication servers that other applications and systems use for authentication purposes together with other techniques to ensure that you do not have to enter their credentials more than once. Kerberos SSO requires specific settings for web browsers. Configure your web browser for SSO support.
The following is an example of the configuration steps in Microsoft Internet Explorer 10: 1 Go to Internet Explorer 10 > Internet Options > Security > Local Intranet, and click Sites. The Local Intranet window opens. 2 Click Advanced. 3 Add your Power Center site into Local Intranet—for example, server1.dcm.dell.com.
Windows NT LAN Manager (NTLM) authentication limitation OpenManage Power Center supports Kerberos SSO for Windows domain user authentication. To enable this feature, OpenManage Power Center is configured to support the Windows integrated authentication option which includes two authentication mechanisms: Kerberos and NTLM . NTLM is not supported in OpenManage Power Center. If the client’s web browser uses NTLM to authenticate domain users for OpenManage Power Center, there are some limitations.
6 • Manage Device/Group • Manage Policy • Manage Event/Log • Manage License • Manage Report • Execute Power Task • Manage Power Task • Backup Database Click Save to add the custom role, or click Cancel to discard your changes and return to the Roles tab. Editing a role NOTE: You cannot edit a predefined role. 1 In the left pane, click Settings > Roles. 2 Select the check box next to the role you want to edit and click Edit.
Every Power Center screen functions differently depending on the privilege level assigned to a user account: • Fully functional—User can view and edit all. • Partially functional—User can partially view or edit. • Not functional—User sees a blank page. Global Configuration The Global Configuration privilege enables a user to change the Power Center global configuration—for example, the sampling interval and database settings.
Users without this privilege can view all devices and group information, but cannot add/delete/edit/manage the devices and groups. Manage Policy The Manage Policy privilege enables a user to: • Add/remove a policy • Update a policy • Start/stop Emergency Power Reduction on a device or group NOTE: To manage a policy, you must also have the View Device/Group privilege. Users without this privilege cannot see the Policies screen.
Execute power task The Execute Power Task privilege enables a user to: • Create power control tasks • Perform power control task Manage power task The Manage Power Task privilege enables a user to: • Manage power control tasks • View power control task • Edit power control task • Re-run power control task • Stop power control task • Delete power control task Backup Database The Backup Database privilege enables a user to: • Manage database policies • Schedule database purge • Configure
For both Windows and Linux installations: • OMPC Account • Enter a unique User Name for the account. • Enter a Password that is at least eight characters long and includes characters from at least three of the following categories: uppercase, lowercase, numeric, and nonalphanumeric. • Re-enter the password in the Verify Password text box to confirm. For a Windows installation: • Windows Local Account — Enter a unique User Name for the account.
Editing a user or group account 1 In the left pane, click Settings > Users. 2 Select the check box next to the user or group account that you want to edit, then click Edit. The Edit a User or Group Account window is displayed. 3 Make the required changes, then click Save to save your changes, or click Cancel to discard them and return to the Users tab. Deleting a user or group account NOTE: You cannot delete the Power Center managed user (super user) created during installation.
6 Task management The Tasks feature enables you to perform device discovery and power control tasks such as power-on and power-off, on a specific device or a group of devices. In the left pane, click Tasks. The Tasks screen comprises the following tabs: • Discovery Tasks • Power Control Tasks By default, the Discovery Tasks tab is displayed.
There are two ways to add a device in Power Center: • Using a single IP address or IP ranges or host names to discover devices on the network, at the scheduled time. • Using the OpenManage Power Center management console to specify device properties and discover devices. NOTE: If you use a network security policy, the discovery function may not work properly.
Re-running recent discovery tasks 1 In the left pane, click Tasks. The Tasks window is displayed. 2 On the Discovery Tasks tab, select the discovery task by clicking on the checkbox. 3 Click Re-Run. 4 After the discovery job completes, go to the Devices screen, and make sure the correct devices are listed. Power control tasks Power control tasks help you to mange the power-on or power-off of devices.
You can set up multiple protocol profiles for each device. Also, you can add a profile, edit an existing profile, or delete a profile. Power Center supports the following connection protocol types, and includes several optional settings: NOTE: Get the correct protocol type and credential information from your system administrator. The user name and password for the IPMI/WS-MAN protocol must be the same as those used for the iDRAC/CMC Web console. • • IPMI: Select IPMI protocol for the server.
• SSH User Name — The user name for WMI-based device communication for managing third-party enclosures. Maximum length is 255 characters. • SSH Password — The password for SSH-based device communication. Maximum length is 255 characters. • WMI Port — The port for WMI-based device communication. The default port is 443. • Validate Certificate — (Optional) Enables device certificate validation. NOTE: You can change the protocol timeout settings in the Settings > General tab.
Adding a protocol 1 In the left pane, expand Tasks, and click Protocols. The Protocols screen is displayed. 2 In the task menu, click Add. The Add Protocol window is displayed. 3 In the Profile Name and Description section, enter a name and a description for the protocol.
4 Click Yes. The selected protocols are deleted.
7 Device Management The Devices feature enables you to view and manage the network-discovered devices and devices added manually. You can also categorize the devices into groups. In the left pane, click Devices. The Devices screen is displayed and comprises the following tabs: • All Devices • Managed Groups By default, the All Devices tab is displayed. You can also view the details of a specific device or device group at the bottom section of the Devices screen.
For unsupported devices: • OpenManage Power Center does not communicate with unsupported devices, therefore connection protocol and credential information is not necessary. • Unsupported devices cannot be discovered; they can only be added manually to the system. • OpenManage Power Center adds the unsupported device to the group structure, but cannot manage it using the available management functions. 1 In the left pane, click Devices > All Devices > Add New. The Add New Device window is displayed.
3 Click Details > Resource Utilization History. The Resource Utilization History- window is displayed, where an is the selected device. 4 Click X in the upper-right corner to return to the Managed Groups tab. Filtering devices The filter feature in the All Devices tab helps you to view devices that share a certain attribute. For example, you can view devices of a certain device type or devices that share an IP range. 1 In the left pane, click Devices.
NOTE: You can select multiple protocols. • Select the Status check box, and select device status from the drop-down list. The available options are: • Connected • Lost Connection • NA NOTE: You can select multiple status. • Select the Device Model check box, and choose a model from the drop-down list. The device model is the specific model information of a device type, for example, PowerEdge M610.
Sorting devices By default, the devices In the All Devices tab, are listed by Name in alphabetical order (A-Z). But you can sort the list as per your requirement. 1 In the left pane, click Devices to view the list of all devices. 2 To sort the devices, click the ‘up’ or ‘down’ arrow next to one of the following column headers: • Status • Device • Device Type • Device Size • Device Model The ‘up’ or ‘down’ arrow is displayed next to the column header by which the display is sorted.
subordinate) or not. Adding a daisy chained PDU to a rack automatically associates the subordinate PDUs to that particular rack. However, you can also associate or disassociate a subordinate PDU from the master PDU individually. NOTE: If you disassociate a subordinate PDU from the master PDU, it is removed only from that particular daisy chain arrangement. NOTE: Deleting a master PDU does not delete the associated subordinate PDUs. Viewing chained PDUs 1 In the left pane, click Devices > All Devices.
• Aisle — Aisle information in Power Center • Rack — Rack information in Power Center • Rack Slot — Rack slot information in Power Center • Custom — Customize the device group NOTE: To view updated location information on supported device, you must make sure the device status has a Connected status in Power Center. It may take a few minutes for location information to update in device firmware.
3 In the task menu, click Move. The Move To Group window is displayed with the list of groups. The Current Entity field displays the name of the group with which the devices are currently associated. The Move To displays the Other option that is selected by default. 4 Select the group to which you want to move the group or device. 5 Click Finish to return to the Devices screen, or click Cancel to discard your changes. 6 Confirm the move: a b Click the Devices > Managed Groups.
The Add to Rack Slots wizard is displayed. 5 Select the check boxes next to the devices you want to add to the rack and click Next. 6 From the Select drop-down list next to the devices you want to add to the rack, select the slots into which you want to place the devices. 7 Click Finish to return to the Manage Rack screen and review your changes. Adding an associated device to a rack 1 In the left pane, click Devices > Managed Groups. 2 From the list of devices select a rack device.
6 Click Yes to proceed with the removal. Removing slotted devices from a rack 1 In the left pane, click Devices > Managed Groups. 2 From the list of devices select a rack device. 3 In the task menu, click Manage Rack. The Manage Rack window is displayed. By default, the Rack Contents tab is displayed. 4 From the list of devices in the rack slots, select the device you want to remove and click Remove from Rack.
CAUTION: Applying emergency power reduction will throttle power on the devices down to an extremely low level, which will impact performance. All devices with Monitor & Capping power capability are impacted. Use this only in an emergency situation. All of the devices with the Monitor & Capping power capability within this group are set to the minimal power consumption state. The Emergency Power Reduction button appears in the upper-right corner of all pages.
8 Virtual machines OMPC monitors the devices, manages the power consumption, and aggregates the observations in the form of a report. However, only physical devices such as server, chassis, UPS, or PDU are monitored. Currently, the power consumption of virtual machines is not monitored. Starting OMPC 4.0, you can discover hypervisors, enumerate virtual machines on the hypervisor, manage power tasks, evaluate, and generate power consumption reports.
4 Enter a name for the filter in the Filter Name (Optional) text box. 5 Do one of the following: • Select the Hypervisor IP Range check box, and enter the start and end IP address of the hypervisor. • Select the Virtual Machine Date Range check box, and enter the start and end date of virtual machine discovery. Enter the dates manually following the format MM/DD/YYYY, or select the dates from the calendar.
Moving a virtual machine group After creating a virtual machine group, you can move the group to another existing virtual machine group. 1 2 In the left pane, click Virtual Machines > VM Groups. Select Move to move a VM group to another VM group. The current VM group is displayed as Current Entity. 3 The available VM groups to which you can move is listed as Move to. Choose the VM group to which you want to move. 4 Click Save. The VM group is moved to the selected group.
9 Power Monitoring Power Center enables the monitoring of current or historical power-related metrics (for example, power consumption or cost). This can help you understand the power status in the data center and plan for additional power infrastructure, cooling, and facility needs. You can monitor power at different device and/or group levels. You can configure power monitoring settings to meet your monitoring needs, and you can print the power status graph.
For more information on configuring default units and energy consumption, see Configuring Energy Consumption Cost Settings. Viewing power details In the left pane, click Devices > All Devices or Devices > Managed Groups. Click the icon for a device or group, then refer to the power detail section of the screen. While OpenManage Power Center does provide power information for PDU and other devices and groups, Power Center does not provide power details for UPS devices.
NOTE: It is common to see that some instantaneous values exceed the Power Cap value in the Maximum line. Power Center monitors this value and controls it to the normal power range with this happens. You only need to pay attention when the Average power value exceeds the Power Cap value. NOTE: You can set the time interval (the period from a time point to the next time point) in the Settings page. For information on configuring the interval, see Monitoring Settings.
Viewing a power history graph OpenManage Power Center provides a visual representation of the power history of the system devices. 1 In the left pane, click Devices > All Devices or Devices > Managed Group. 2 From the list of devices, select a device. The details of the device are displayed in the Details section. 3 In the Details section, click the Thresholds tab. 4 Click View History next to Power Alert Thresholds. The Power History — window is displayed.
You can also generate reports and view the details. For more information on creating PDU reports, refer Managing Reports. Monitoring UPS Power To monitor UPS power, click Devices in the left pane, and then select the UPS. The UPS details are displayed in the Details section of the screen. The instantaneous power value of the UPS is shown, as well as the UPS details read from the device. It displays NA when the data is not provided on the UPS.
10 Temperature Monitoring OpenManage Power Center enables monitoring of the current and historical server inlet temperature of the data centers in Power Center. This can help you understand the temperature status and identify hot spots in the data center. You can monitor the temperature status at different device/group levels. You can configure the temperature monitoring settings to meet your monitoring needs, and you can print the temperature status graph.
Table 5. Time Windows and Intervals Time Window Description Interval 15Min 15 minutes 1 minute 1H 1 hour 3 minutes 1D 1 day 1 hour 1W 1 week 6 hours 1M 1 month 1 day 3M 3 months 1 week 1Y 1 year 2 weeks NOTE: This table lists the interval when the sampling interval is at the default value (1 minute). Changing the sample interval results in interval changes for the 15Min and 1H time windows.
Viewing a temperature history graph OpenManage Power Center provides a visual representation of the temperature history of your system devices. 1 In the left pane, click Devices > All Devices or Devices > Managed Group. 2 From the list of devices, select a device. The details of the device are displayed in the Details section. 3 In the Details section, click the Thresholds tab. Alternately, you can also click Thermal History in the Summary tab.
Monitoring the Temperature of Devices/Groups Power Center supports temperature monitoring of the inlet temperature span for devices and groups. The inlet temperature span is the average inlet temperature differential between the maximum and minimum temperature reading for a device in a group (Celsius or Fahrenheit). You can calculate this value according to the maximum and minimum temperature from the Temperature Details graph.
11 Policies A power policy is a set of configurations to manage the power cap for a device or group. A policy is useful for power management in different situations. For example, you can create a policy to: • Power Cap — Make sure that power consumption does not exceed the capacity of the circuit. • Control Power Usage — Schedule power usage according to the workload of the device or group.
Dynamic power caps The following terms are helpful for understanding how a dynamic power cap works: • Consumption — The amount of power a device is using. • Power Cap — The maximum amount of power that a device is allowed to consume (may not be equal to its demand).
• You cannot edit the policy of this device from the Policies page; you can only delete it. Scenario 2 — You try to import a license on a device without a license imported In this case, the following happens: • If a policy exists on the devices, a "Server Capabilities Changed" event is generated. • The Policies tab of the devices is set to Enabled in the Groups page. The power capability status of the devices is changed in the Devices page. The policy of the devices is editable.
• Previous day • Previous week • Previous month 8 • Previous quarter Enter a value in the Power Cap Value text box. 9 Click Next to continue, click Back to return to the previous screen, or click Cancel to discontinue the task. 10 In the Power Cap Priorities window, select an option from the Priority drop-down list to set the capping priority for each device in the group.
• If there are overlapping policies on an entity, the policy with the lowest power cap is applied. • If there are overlapping dynamic policies on an entity and both are currently active, the highest priority (High > Medium > Low) of this entity is applied. Policy Modes The policy mode is shown in the Enabled and Active columns in the Policies page. A green symbol indicates Enabled or Active. Power Center supports three policy modes: Table 6.
Deleting a policy 1 In the left pane, click Policies. The Policies screen is displayed. 2 In the list of policies, select the check box next to the policy that you want to delete. NOTE: You can select more than one policy to at a time. 3 In the task menu, click Delete. The following message is displayed : Are you sure you want to delete the selected item(s)? 4 Click Yes. Filtering policies You can filter policies so they display according to type, power cap, status, and/or other attributes.
12 Analysis This chapter provides information about various graphs and helps in analyzing the artifacts derived from the observation. The Analysis feature enables you to view a graphical representation of the server characteristics, power or thermal characteristics, and also the underutilized servers. You can export the report in XML or CSV format. The graphs are useful in analyzing the power and thermal issues, to measure the server characteristics and utilize them efficiently.
Viewing peak power distribution graph OMPC enables you to view the details about the distribution of peak power for the servers. 1 In the left pane, click Analysis > Server Characteristics. 2 In the task menu, click Peak Power. The Peak Power Distribution — graph is displayed. 3 Set the power range distribution value by typing the value in Set Y-axis Power Range Granularity text box and click Apply.
The following formulae is used used in calculating the underutilization value of a server, Servers with an average utilization of less than or equal to , where represents a utilization percentage. The range is between 80% to 20%, by default the value is set to 15. Servers with percentile utilization being less than or equal to . , where is the percentile. The range is between 0% to 20%, by default the value is set to 95.
3 From the Group Selection tab, select the data centers by clicking + to analyze the availability of power and space. Click Next. 4 In the Placement Type tab, select the type of placement required from the drop-down list. The available options are Auto and Manual. By default, Auto option is selected. 5 Select the server model from the Server Model drop-down list for which you require placement suggestions. 6 Enter the number of servers in the Server Count text field.
• Hot outlier room Configuring cooling analysis settings 1 In the left pane, click Analysis and then click Cooling Analysis. The Data center Cooling Analysis page is displayed. 2 Click . Cooling Analysis Settings window is displayed. 3 Select the threshold temperature from the drop-down list to classify a room as Hot Room. 4 In the Hot Outlier Devices section, type a value in the text box to classify a device as a Hot Outlier Device.
The Data center Cooling Analysis page is displayed. 2 In the Hot Outlier Devices section, you can view the rooms in which are classified as hot outlier room. Room : Devices Under Hot Outlier Room window is displayed. The details of the devices are displayed along with the reason for the scenario along with the resolution. 3 96 Click Close.
13 Managing reports This chapter provides information on periodically generating reports for inventory and monitoring and managing the reports. Pre-defined templates are provided to help you generate the reports. By default, the reports are generated in HTML format. You can download the reports in XML or CSV format. In the left pane, click Reports. The Reports screen is displayed.
• Highest Temperature — The Highest temperature report displays the devices that has the highest temperature. • Lowest Temperature — The Lowest temperature report displays the devices that has the lowest temperature. • Events Reports — The Events report displays the events with a specified severity level for a specified time-period. • PDU Outlet Assignment — The PDU outlet assignment report displays the PDU name, PDU IP, PDU location, PDU outlet assignment and other relevant details.
• Power Cap Settings • Threshold Settings • Rack Fragmentation Hoarders • Rack Space Hoarders • Rack Space Frugal • Highest Temperature • Lowest Temperature • Events Report • PDU Assignment Report • PDU Sensor Report • Thermal Event Policy • VM Power Hoarders • VM Power Frugal • VM General Inventory The New Report wizard is displayed. 3 Enter a name for the report in the Name text box.
a b 10 From the Limit Output to drop-down list, select the output limit for the report. The available options are: • 10 • 50 • 100 • All From the Sort by drop-down list, select an attribute by which you want the sort the report. Select the Ascending or Descending option to sort the report in that order and click Next. In the Save/Run tab, do one of the following: • Select the Save Only option to save the report.
3 Click Save to save the changes or click Cancel to return to the Reports screen without saving the changes. Deleting report groups 1 Click Reports > Report Group. The Add/Edit/Delete Report Groups window is displayed. 2 Select the group that you want to delete from the Group drop-down list. 3 Click Delete. The following message is displayed. Are you sure you want to delete this group? If you delete the group, all reports under this group will be deleted. 4 Click Yes to proceed.
14 Event Management This chapter provides information on event types, severity levels, supported UPS/PDU events, and how to manage Power Center events. You can receive events indicating an abnormal power/temperature situation in the data center. Power Center detects: • Pre-defined events • Custom events Power Center uses port 6553 to listen for internal events. If another application is configured to use port 6553, you must change it to reserve port 6533 for Power Center.
• PowerEdge blade servers – Only support IPMI Processor Temperature Trip events. • Integrated Dell Remote Access Controller (iDRAC) – Only supports the IPMI trap format. To receive events from an iDRAC device, make sure the alert function is enabled and the IPMI trap format is selected for all Power Center-supported events in the iDRAC management console (IPMI Power Unit, IPMI Power Supply, IPMI Processor Temperature Trip, IPMI Fan).
Type Description Severity Level MPCM Configure Failed Failed to set MPCM on the chassis. Warning MPCM Not Supported The Dell chassis does not support MPCM. Warning Upgrading firmware on the chassis might be required. PDU High Load The PDU power is greater than the high load Warning threshold. PDU Low Load The PDU power is lower than the low load threshold. Warning PDU Outlet High Load The PDU outlet power is greater than the high load threshold.
Type Description Severity Level UPS Input Power Events related to power input failure in the UPS. Critical UPS On Bypass Events related to on bypass in the UPS. Informative UPS Output Power Events related to power output failure in the Critical UPS UPS Overload Events related to output power load limits and exceeded thresholds in the UPS. Critical UPS Shutdown The UPS has shutdown. Informative UPS Temperature Threshold A UPS temperature threshold was exceeded.
threshold, then Critical and Warning events are sent when the average temperature reaches 60 °C. When the average temperature returns to 45 °C, the Critical event automatically becomes Informative. When the average temperature returns to 35 °C, the Warning event automatically becomes Informative. Application log events The application log contains information about informational or unexpected events, or internal errors that occur in OpenManage Power Center. Table 10.
Table 11. PDU and UPS events PDU/UPS Model Supported Events Dell UPS UPS Low Battery, UPS Bad Input APC UPS UPS Low Battery, UPS Shutdown, UPS On Bypass Eaton UPS UPS Low Battery, UPS Bad Input, UPS Bad Battery Emerson UPS UPS Low Battery Dell PDU PDU Low Load, PDU High Load, PDU Overload, PDU Outlet Low Load*, PDU Outlet High Load*, PDU Outlet Overload*, PDU Outlet On*, PDU Outlet Off* NOTE: Events marked with * are only supported on Dell Managed Rack PDU 6605.
A list of the recent critical events is displayed. b Click View Events. The Events screen with the list of events is displayed. • From the Home screen: a In the left pane, click Home. The Events (Overall) and Events (Top 5 Groups) graphs are displayed. b Click View Events. The Events screen with the list of events is displayed. NOTE: By default, the protocol error events are hidden. To view these events, click Settings > Database.
The following message is displayed. Are you sure you want to delete the selected item(s)? 4 Click Yes to proceed with the deletion. NOTE: You also have the option to delete all the events by clicking Delete All. Filtering events The Events Filter feature helps you to view events of specific types, severity levels, Acknowledged By user name, and/or events that occur within a specific time period. 1 In the left pane, click Events. 2 In the task menu, click Filter. The Events Filter window is displayed.
Sending test events from an IPMI device Power Center enables you to view test events sent from an IPMI device, therefore, you can verify the event channel between the IPMI device and Power Center server. Before sending a test event, make sure: • The IPMI device is added on the Devices page. • The network connection status of the IPMI device is Connected. • The Power Center server address is added in the event destination list of the IPMI device.
15 Security Power Center is designed to ensure data confidentiality, data integrity, and the security of user authentication. Power Center not only provides authentication and access control to user accounts (see Access Control), but also protects all of the communication channels to the Power Center server and the stored sensitive data (for example, passwords) on the Power Center server.
• Dell\OpenManagePowerCenter\conf\app.config.xml • Dell\OpenManagePowerCenter\external\apache-tomcat\conf\context.xml • Dell\OpenManagePowerCenter\external\apache-tomcat\conf\server.xml • Dell\OpenManagePowerCenter\external\apache-tomcat\conf\tomcat-users.xml • Dell\OpenManagePowerCenter\external\apache-tomcat\conf\web.xml • Dell\OpenManagePowerCenter\keystore.ssl • Dell\OpenManagePowerCenter\pgdata\pg_hba.conf • Dell\OpenManagePowerCenter\pgdata\postgresql.
Action Tracked Information Add/remove user to role User name, old/new value of role name Add/remove user User name The event logs are kept in the log file. You can find the log file(s) in: \OpenManagePowerCenter\logs\Audit.log.x. Where x is the incremental number, if applicable (shown below.) The total size of all audit log files is limited to 20 MB. Power Center keeps up to three audit log files of approximately 6.67 MB each.
16 Configuring settings You configure the OpenManage Power Center settings in the Settings screen. The Settings screen comprises the following tabs: • General — Configure the timeout for console and device communication. • Monitoring — Configure the power/thermal units and energy consumption parameters. • Alerts — Configure alerts for SNMP traps, enable or disable sending alerts through emails, configure email recipients, and event severity-level.
3 Click Save to save the changes or click Reset to revert to the previously saved settings. Setting protocol timeout periods 1 In the left pane, click Settings. By default, the General settings screen is displayed. 2 In the Protocols Timeout section, enter the time in seconds for the specified communication protocol (IPMI, SNMP, WS-MAN, HTTPS, or SSH). OpenManage Power Center considers the device not reachable if it cannot get any response from the device within the timeout period.
• Power/Temperature sampling interval — Every 30 minutes, for example, 08:00, 08:30, 09:00, and so on. Configuring the power and temperature sampling intervals 1 On the Settings screen, click the Monitoring tab. Select the Monitoring all devices and groups check box to enable the power and thermal monitoring of all devices and groups. 2 Enter values in the Power Sampling Interval and Temperature Sampling Interval text boxes. The default power and temperature sampling interval is one minute.
You can set the following for database maintenance: • Data compression — Set the number of the days (1-14) to keep the non-compressed data. The default is 7 days. • Purge data (older than) — Set the number of the days (1-365) to keep the compressed data and the event logs. The default is 365 days. • Schedule Purge — Set the time of day to start database purging (00:00:00 - 23:00:00). The default is 23:00:00. You can also purge the data immediately by clicking Purge Now.
7 • Click Run Once option to schedule one time database backup. Specify the date and time of the schedule. • Select Periodic option and specify if the database backup has to happen daily, weekly, or on a specific day. NOTE: Under the Range of recurrence option, select the start and end date for the task, or select the No End Date option to run the task for an unlimited period. Click Apply to save the changes or click Cancel to revert to the previously saved settings.
Option Description Network Timeout Specify the time, in seconds, for which OpenManage Power Center LDAP must wait for connecting to the LDAP server. The default timeout is 30 seconds. Search Timeout Specify the time, in seconds, after which the OpenManage Power Center LDAP stops waiting for a response to the search request. The default timeout is 120 seconds. Enable Certificate Validation Select this check box to enable the LDAP certificate validation.
• 4 Enable Certificate Validation — If this option is selected, Power Center uses the CA certificate to validate the LDAP server certificate during the SSL handshake. • Upload Directory Service CA Certificate (optional unless Certificate Validation is enabled) — Click Browse and navigate to the CA certificate you want to upload, then click Open to upload the new certificate. • Directory Service CA Certificate Information — Displays information about the CA certificate that is in effect.
• Power Return To Normal • Temperature Return To Normal The SNMP traps enable you to identify OpenManage Power Center-specific alerts on the third-party consoles. 1 In the left pane, click Settings > Alerts. 2 Select the Enable SNMP Traps check box. 3 Enter the following information: 4 • The IP address or hostname (Destination IP/Host) of the destination device to which events are sent. The maximum length is 255 characters. • The port number (Port) of the destination device.
Licensing OpenManage Power Center requires a valid license for capping the 13th and 14th generation of PowerEdge systems (advanced power capping). NOTE: Starting OpenManage Power Center 4.0, you do not require a license to monitor a Non-Dell device (third-party power monitoring), as the support is in-built with the software. If a Non-Dell license exists, the status is displayed as Obsolete. The licenses are of three types: • Trial — These licenses are valid for a limited duration only.
The default interval is 30 minutes. 3 Click Run Now to run the inventory check immediately. The Last search for chassis inventory run at displays the timestamp at which the inventory check was last run. 4 Click Save to apply your changes or click Reset to revert to the previously saved settings. NOTE: The chassis inventory operation is applicable only to the chassis that is discovered and added to a managed group.
17 Logs The Logs feature displays information about unexpected or informational events, or internal errors that occur in OpenManage Power Center. The latest application log is displayed on the top of the list. A log can have a maximum of 1,00,000 entries. In the left pane, click Logs. The Application Logs screen is displayed.
18 Troubleshooting This chapter lists some of the known issues you may encounter when working with Power Center. Why am I being required to log in more than once by Power Center? Possible Cause: This occurs when one of the following elements of Kerberos SSO is not correctly configured: the Power Center server, the web browser, or the AD domain controller configuration. Resolution: Correctly configure your Power Center server and web browser for Kerberos SSO.
Resolution: Wait one minute or more for iDRAC6 devices to release the connection sessions, then try again. Why can’t Power Center receive events sent from devices? Possible Cause: Power Center is not the destination host of the events sent from devices. Resolution: Make sure the Power Center server’s IP address is registered on the device as the destination for events. Possible Cause: There is a network connection problem.
this error is generated. Since such an error is caused by Windows when it shuts down the services quickly, Power Center protects the important data through transaction; therefore, this kind of error does not impact Power Center. Resolution: No action is required. Why I can’t open power center login page when I access it through Firefox 31? Possible Cause: During the installation of power center, a self-signed certificate is created for power center.
Why do I encounter a network exception while adding a chassis to a group? Possible Cause: The chassis platform response could be slow. The web server may timeout before the chassis responds to OpenManage Power Center, resulting in the network exception. Resolution: The chassis is added to the group at the back-end, but the GUI times out before the chassis responds to OpenManager Power Center.
Resolution: Add devices to the group and assign power before viewing the graph. Scenario 3 Possible Cause: The Power Capacity of the group is not available. Resolution: Configure the power capacity of the group or add rack (for which the power capacity is mandatory) in a group, so that the power capacity of the group can be calculated from the power capacity of the racks in that particular group. Scenario 4 Possible Cause: The monitored peak power of the group is higher than the power capacity of the group.
A Upgrade failure recovery on Microsoft Windows operating system Check OMPC status If the installer process is stopped or server is switched off during upgrade, the upgrade fails. Follow the steps to troubleshoot the upgrade failure scenario: 1 Run wmic product where name='Dell OpenManage Power Center' get version command on the windows command line interface to get the current version OMPC. 2 If the OMPC old version is displayed, for example 3.1.0.
NOTE: In some case (Power off or killed OMPC installer program), there is still a corrupt OMPC in the Windows OS. It may not be able to uninstall by the above command and will block any new OMPC installed. In this case, you need to remove OMPC manually. 2 a Open register table using the regedit command and search all key or value include {79427712-CD0A-4114A571-6BCA07F2EE0A}. Remove all key or value found. b Stop all OMPC services if they exist.
B Upgrade failure recovery on Linux operating system Use install.sh command in the new OMPC version package to do upgrade or install OMPC. The install.sh command detects the version of OMPC. if there is an old version installed, upgrade process is initialized. If not, then a new version is installed. NOTE: If you use rpm -U during the OpenManage Power Center installation or upgrade, many warning messages will get displayed.
b [PGSQLDRV]= postgresql-8.3-603.jdbc4.jar if target version below 3.1; You can get the current database version by the DB_VERSION item in [InstDir]/dbinfor.tmp. Check the availability of /etc/ompc/ upgradeok: If it exists, it means upgrade completed. If not, new OMPC installed but upgrading yet to be completed. Rollback to previous OMPC version 1 Launch roll back script: /etc/ompc/backup/ompcrollback.sh. 2 Use PGAdmin to login OMPC database dcmapp with OMPC database user.